Create a dashboard with data from the last 7 days. (1 Viewer)

Derek

Registered User.
Local time
Yesterday, 21:54
Joined
May 4, 2010
Messages
234
Hi Guys

I have Access table tblupdate that stores following fields:
Date,Username,To_Be_Updated,TargetDate

Now I want to create a dashboard that will show data of last 7 days from todays dates in 3 charts :

  • 1st chart with Red colour (That means if todays date is greater than TargetDate)
  • 2nd Chart with Green Colour (That means if todays date is less than target date)
  • 3rd chart with AMber colour that means if todays date is equal to Date field.
Can anyone please help me in this? Any queries please let me know.

Thanks
 

Derek

Registered User.
Local time
Yesterday, 21:54
Joined
May 4, 2010
Messages
234
Thanks Paul, Can you please help me in creating Pivot Chart ? I want the chart to be displayed on the screen when the button on the form is clicked.

Many Thanks
 

Derek

Registered User.
Local time
Yesterday, 21:54
Joined
May 4, 2010
Messages
234
Thanks Paul. But can you elaborate how this can be done ? Any help would be much appreciated.
Many Thanks
 

pr2-eugin

Super Moderator
Local time
Today, 05:54
Joined
Nov 30, 2011
Messages
8,494
One of my gurus at Microsoft has elaborated how to do it, in the link I provided.
 

Derek

Registered User.
Local time
Yesterday, 21:54
Joined
May 4, 2010
Messages
234
Hi namliam, Is there any way we can write down crosstab queries or Pivot charts to display the required data?

Many Thanks
 

pr2-eugin

Super Moderator
Local time
Today, 05:54
Joined
Nov 30, 2011
Messages
8,494
...thinking we had something special!
Hush now. Lol. We do not want the others to know.


Derek

Registered User.
Local time
Yesterday, 21:54
Joined
May 4, 2010
Messages
234


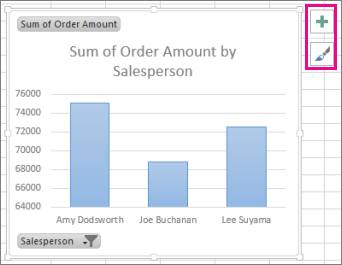
Is it possible to create this type of chart that will show three bars in Green,Amber and Red colour?
 

namliam

The Mailman - AWF VIP
Local time
Today, 06:54
Joined
Aug 11, 2003
Messages
11,695
You should be able to stack the information in different columns
 

Derek

Registered User.
Local time
Yesterday, 21:54
Joined
May 4, 2010
Messages
234
namliam, Please guide me in this as I never created Pivot charts before. See my first post to know what exactly I want. I want three bars in the chart to be Amber,Green and Red colour. so it should check for the last 7 dates from todays date, check if todays date is equal to Date then colour will be amber, if todays date is less than equal to target date then the colour will be Green but if todays date exceeds Targer date then colour will be Red .

I think I will need to write VBA code for this so that when a button on the form is clicked then perform the above steps and display data in a chart.

ANy help would be much appreciated. Thanks
 

namliam

The Mailman - AWF VIP
Local time
Today, 06:54
Joined
Aug 11, 2003
Messages
11,695
Not sure if a graph in access can do that, I never make graphs in access because Excel is just that much better at it IMHO (this may be history with the newer versions?)

Dont really have the time right now to go research access graphs for you.
 

Derek

Registered User.
Local time
Yesterday, 21:54
Joined
May 4, 2010
Messages
234
namlian, any other way to get my task done?? I mean clicking a button on Access form to display a chart in excel etc.
 

namliam

The Mailman - AWF VIP
Local time
Today, 06:54
Joined
Aug 11, 2003
Messages
11,695
If you can make your desired graph in excel you can make it happen from a button
 

Derek

Registered User.
Local time
Yesterday, 21:54
Joined
May 4, 2010
Messages
234
come on namliam. As I said I have no idea how to get this done so plssss help me to figure it out. Thanks
 

pr2-eugin

Super Moderator
Local time
Today, 05:54
Joined
Nov 30, 2011
Messages
8,494
I thought I would stay away from this. Well, I am just going to say it. If you want your work done for you, then please send me some cash through PayPal, and I will do it for you. Or ask for namliam's PayPal account and pay him some, he will take the time to do the research for you and do it.

We are here to help, voluntarily taking our personal time to help you out. Does not in any way mean we will go the distance of doing the research and doing your home work for you for free.

You have been provided with a link to guide you through how you have to create a Pivot Chart. Suggestion of how to handle an Excel object in Access. If you are not going to do even the bare minimal effort of researching for your work, why would a random person on the internet toil for it?

There are plenty of examples of how to manipulate Pivot Charts and Tables on the internet. If you had gone through some of it, did something and are stuck at some point we would be happy to guide you through, not do the entire work for you ! :mad:
 

Derek

Registered User.
Local time
Yesterday, 21:54
Joined
May 4, 2010
Messages
234
Well Paul, This is totally a new topic which I have never done before. These situations come in everybody's life and I am sure u also faced these issues when u just started working in Access/Excel .

Anyway thanks for your help. I really wanted someone to guide me and not to do homework for me. :(
 

Users who are viewing this thread

Top Bottom