mawcluster
New member
- Local time
- Today, 08:03
- Joined
- Jan 15, 2007
- Messages
- 7
Hello all. My client has decided they like the pivotchart format better than the regular chart format, especially for its dynamic quality ( it can expand and contract with form adjustments.
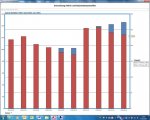
One chart I am having trouble replicating in pivotchart format is one that plots two data series. One series is made of columns representing large numbers, generally several hundred or thousand, and the other data series needs to be a line which usually ranges between 0-10.
Obviously they cannot be represented on a y-axis with the same scale. This is simple to handle in MS Chart.
Is there a way to make a pivotchart with a dual-scaled y-axis, and map a data series to each one?
Thanks in advance.