Hello,
I have set up a report with an OLE-object which is a MSGraph.Chart.8 . The chart data comes from a query to a table which data (statistics) is written new every time a user starts the report (in fact I run code for compiling the statistic data first and then per VBA open the report).
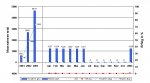
(Short what the statistic is about. The first value is the total amount of records which have been created in a certain time period, the second value is the amount of records which match certain conditions in that same period. And there is a percentage line which gives the ratio between this two in %).
What happens now is, when I open the report, the chart shows occasionally the data from the example table of the graph instead of the real data from the query.
Second thing is, that the chart has to vertical axis, one for the number of records (see above) and one for the percentage value. I would like to force the graph to have both axis start at 0 and cross at 0 with the horizontal axis.
What I did was in Format menu - Axis of MSGraph I dechecked the check boxes for Minimum and set it to 0, as well as I set the cross horizontal axis value to 0. What else do I need for it to work?
I would appreciate any help.
Thank you.
Mary H.
P.S. I've attached a graph as bmp
I have set up a report with an OLE-object which is a MSGraph.Chart.8 . The chart data comes from a query to a table which data (statistics) is written new every time a user starts the report (in fact I run code for compiling the statistic data first and then per VBA open the report).
(Short what the statistic is about. The first value is the total amount of records which have been created in a certain time period, the second value is the amount of records which match certain conditions in that same period. And there is a percentage line which gives the ratio between this two in %).
What happens now is, when I open the report, the chart shows occasionally the data from the example table of the graph instead of the real data from the query.
Second thing is, that the chart has to vertical axis, one for the number of records (see above) and one for the percentage value. I would like to force the graph to have both axis start at 0 and cross at 0 with the horizontal axis.
What I did was in Format menu - Axis of MSGraph I dechecked the check boxes for Minimum and set it to 0, as well as I set the cross horizontal axis value to 0. What else do I need for it to work?
I would appreciate any help.
Thank you.
Mary H.
P.S. I've attached a graph as bmp