Hi all, it's me again. I am still strugling with my access database.
After you said my database was all wrong, I started over again.
I did manage to solve a few issues. Now I am stuck again like a real noob.
Situation:
Table1 = contains the information of which I would like to show de graphs
Table2 = contains the values for the x-axis of the bar graph (contains an ID, From, To columns and even a graph point number <- not sure why I have put it in there)
In table 1 I have dealers (through lookup from another table) and I got Serialnumbers of machines and columns with hour meter readings.
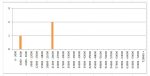
The bar graph I need to make is:
y-axis = number of machines in a specific range
x-axis = hour meter readings per 3000 hours. (range from 0-72000, in steps of 3000)
I need to get the value of the hour meter column from table1 and determine in which section (read bar of the bar graph) this value is. Then when there are multiple machines I need to increase the number of machines for that specific bar. (see attached jpeg).
I got is working in excel only I need to make it automated incase the number of machines change.
Where do I start to get this to work? :banghead:
After you said my database was all wrong, I started over again.
I did manage to solve a few issues. Now I am stuck again like a real noob.
Situation:
Table1 = contains the information of which I would like to show de graphs
Table2 = contains the values for the x-axis of the bar graph (contains an ID, From, To columns and even a graph point number <- not sure why I have put it in there)
In table 1 I have dealers (through lookup from another table) and I got Serialnumbers of machines and columns with hour meter readings.
The bar graph I need to make is:
y-axis = number of machines in a specific range
x-axis = hour meter readings per 3000 hours. (range from 0-72000, in steps of 3000)
I need to get the value of the hour meter column from table1 and determine in which section (read bar of the bar graph) this value is. Then when there are multiple machines I need to increase the number of machines for that specific bar. (see attached jpeg).
I got is working in excel only I need to make it automated incase the number of machines change.
Where do I start to get this to work? :banghead: