You are using an out of date browser. It may not display this or other websites correctly.
You should upgrade or use an alternative browser.
You should upgrade or use an alternative browser.
Can I create many of chart in one pivot chart in access?
- Thread starter Elhbeb
- Start date
RainLover
VIP From a land downunder
- Local time
- Tomorrow, 07:25
- Joined
- Jan 5, 2009
- Messages
- 5,041
I am not sure I can do what you want.
Maybe someone else can help.
Can you give more information.
How did you create the chart that you displayed.
Did you use Excel?
If you did this in Excel can you post that.
Maybe someone else can help.
Can you give more information.
How did you create the chart that you displayed.
Did you use Excel?
If you did this in Excel can you post that.
Then do as RainLover said, explain how did you do that in Excel.
Input data, chart type, line/point setting etc.
Sorry for the delay in a reply!
I don't understand what you need?
You want explain how do that in excel .............
RainLover
VIP From a land downunder
- Local time
- Tomorrow, 07:25
- Joined
- Jan 5, 2009
- Messages
- 5,041
Quote from Post # 4
Does this create a problem?
If you did this in Excel can you post that.
Does this create a problem?
Quote from Post # 4
Does this create a problem?
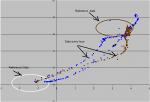
My Excel chart in the attachments files. "Create by Excel 2003"
Please help me for create same this by access..
I'm wait for any question for the chart in Excel and any thing in Excel I'm good work in Excel application.....
Attachments
RainLover
VIP From a land downunder
- Local time
- Tomorrow, 07:25
- Joined
- Jan 5, 2009
- Messages
- 5,041
As I said much earlier I may not be of much help.
Have you imported your raw data into Access Tables.
If so have you then tried yo use the Chart Wizard.
I think a Chart in Access is very similar to Excel
If you have not done the above then what have you tried. Did you find any usefull information using Google.
Have you imported your raw data into Access Tables.
If so have you then tried yo use the Chart Wizard.
I think a Chart in Access is very similar to Excel
If you have not done the above then what have you tried. Did you find any usefull information using Google.
As I said much earlier I may not be of much help.
Have you imported your raw data into Access Tables.
If so have you then tried yo use the Chart Wizard.
I think a Chart in Access is very similar to Excel
If you have not done the above then what have you tried. Did you find any usefull information using Google.
Thank you for your reply..
Actually a Chart in Access is similar to Excel bu dont have every thing in excel chart
Excel can use any data from any sheet, but access use data from one teble.
I tried that, and I don't find any usefull information using Google.
Again Thank you for your reply and Continue.
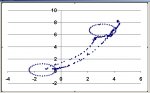
If you can use the below, then I can give an example how to do it! But you can't make cirkels for End ref and Start ref.
Excel version is 2010
Attachments
Last edited:
I've send you an example database.
All data is in one table with 2 fields.
The graph is on the form "GraphForm"
Any question, then ask.")
Thank you very much...
You insert data with the reference data in one table.
This good idea but not fix the problem for me because I insert data every hour with different users, I need every user look at this data understand every thing easily.
Data is different color and different line.
Thank you very much, and your idea is very very good.
Last edited:
Similar threads
Users who are viewing this thread
Total: 1 (members: 0, guests: 1)