Sniper-BoOyA-
Registered User.
- Local time
- Today, 10:51
- Joined
- Jun 15, 2010
- Messages
- 204
Good Afternoon,
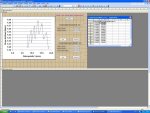
I am having a problem with a scatter plot i made in access..
I made 2 graphs this morning. Each graph represents some test results, but both calculated in a different way.
The first graph works just fine. And the query behind it is :
Result:
queryproctwtrgehgrfkwatergehproctdrgdichtheidproctproctorID15.89772552251821632.14029948657118.50915104150771596.26470074058116.09657853841781626.96746002226113.66503238677981644.96084284047111.65049374103551628.9077988212419.778814762830731615.6788463783717.902978360652921599.19947561719118.50915104150771596.26470074058216.09657853841781626.96746002226213.66503238677981644.96084284047211.65049374103551628.9077988212429.778814762830731615.6788463783727.902978360652921599.199475617192
As you can see it shows 2 proctor id's, but only 1 id (the first one) will be shown on the graph, like its supposed to.
Explanation : This is about sand. we get a sample, and in that sample we determine the water density by using a proctor, use it to make a few samples out of the big one, and then we do some tests to determine the density.. Anyways, to keep it simple. The test is being made with 1 proctor at a time.
This is in kg/m³.
Now on the second graph is for the european requirements, which needs a little bit more calculation. It gets a percantage, and if that percentage is higher than 10%, an extra test has to be done. Just a little correction.
All this is put into an other query. When i try to make a graph from that query, i see 2 proctors for some reason.
Query2:
Result :
queryproctwtrgehgrfkNENdrgdichtheidproctwatergehproctproctorID1.636480673764587.8566976971370911.653751508456459.5599323005261211.668031481547911.259392018022311.6850219220753713.088566421137911.6713233454773615.296378115376911.6458031863898317.48696198808411.6758333947875115.115822211207811.599199475617197.9029783606529221.615678846378369.7788147628307321.6289077988212411.650493741035521.6449608428404713.665032386779821.6269674600222616.096578538417821.5962647007405818.50915104150772
As you can see these results also show 2 proctors.
The graph will be shown on a sub form, and ProctorID is pretty much what holds everything together.
Now the thing ive noticed is that if you look at the graphs data, the first one shows only the proctor 1 entries. But the second graph shows both.
I also noticed that when i change the following formula to something that doesnt require both table "tblproctrwtrgeh" and "queryproctrproefNEN", it works fine. So i assume it has something to do with the relationship between the table and the query?
Does anyone have any idea what could cause the fact that the 2nd graph keeps showing both proctorID 1 and proctorID2..
Ive tried to adjust the properties of the relationships -- > no luck
Ive tried to make a table wich contains everything from the 2nd query --> no luck..
The only thing that did work was to set the criteria to 1 for the ProctorID ..
..
Anyways, i know this is a lot of information, so if u request some more info or even the database, let me know.
Thank in Advance!
I am having a problem with a scatter plot i made in access..
I made 2 graphs this morning. Each graph represents some test results, but both calculated in a different way.
The first graph works just fine. And the query behind it is :
Code:
SELECT IIf(IsNull([schaalnr]),[topwtrgeh],(([massaschlmonnat]-[massa3])/([massa3]-[massaschl]))*100) AS watergehproct, IIf(IsNull([schaalnr]),[topdrgdichth],((([massacillmonnat]-[massaopv])*100000)/([inhpv]*(100+[watergehproct])))) AS drgdichtheidproct, tblproctor.proctorID
FROM (tblopvklei INNER JOIN tblproctor ON tblopvklei.opvnr = tblproctor.opvnr) INNER JOIN tblproctwtrgeh ON tblproctor.proctorID = tblproctwtrgeh.proctorID
ORDER BY tblproctor.proctorID;
Result:
queryproctwtrgehgrfkwatergehproctdrgdichtheidproctproctorID15.89772552251821632.14029948657118.50915104150771596.26470074058116.09657853841781626.96746002226113.66503238677981644.96084284047111.65049374103551628.9077988212419.778814762830731615.6788463783717.902978360652921599.19947561719118.50915104150771596.26470074058216.09657853841781626.96746002226213.66503238677981644.96084284047211.65049374103551628.9077988212429.778814762830731615.6788463783727.902978360652921599.199475617192
As you can see it shows 2 proctor id's, but only 1 id (the first one) will be shown on the graph, like its supposed to.
Explanation : This is about sand. we get a sample, and in that sample we determine the water density by using a proctor, use it to make a few samples out of the big one, and then we do some tests to determine the density.. Anyways, to keep it simple. The test is being made with 1 proctor at a time.
This is in kg/m³.
Now on the second graph is for the european requirements, which needs a little bit more calculation. It gets a percantage, and if that percentage is higher than 10%, an extra test has to be done. Just a little correction.
All this is put into an other query. When i try to make a graph from that query, i see 2 proctors for some reason.
Query2:
Code:
SELECT IIf([Corrigeren]="Ja",(((([massacillmonnat]-queryprctrproefNEN!massaopv)*100)/([inhpv]*(100+[watergehproct])))*(1-([massaststdrg]/queryprctrproefNEN!massamnstr)))+(0.9*[dchthdstst]*([massaststdrg]/queryprctrproefNEN!massamnstr)),(([massacillmonnat]-queryprctrproefNEN!massaopv)*100)/([inhpv]*(100+[watergehproct]))) AS drgdichtheidproct, IIf([corrigeren]="Ja",(((([massaschlmonnat]-[massa3])/([massa3]-[massaschl]))*100)*(1-[massaststdrg]/queryprctrproefNEN!massamnstr))+([watergehstst]*([massaststdrg]/queryprctrproefNEN!massamnstr)),(([massaschlmonnat]-[massa3])/([massa3]-[massaschl]))*100) AS watergehproct, queryprctrproefNEN.proctorID
FROM (queryprctrproefNEN INNER JOIN tblopvklei ON queryprctrproefNEN.opvnr = tblopvklei.opvnr) INNER JOIN tblproctwtrgeh ON queryprctrproefNEN.proctorID = tblproctwtrgeh.proctorID;
Result :
queryproctwtrgehgrfkNENdrgdichtheidproctwatergehproctproctorID1.636480673764587.8566976971370911.653751508456459.5599323005261211.668031481547911.259392018022311.6850219220753713.088566421137911.6713233454773615.296378115376911.6458031863898317.48696198808411.6758333947875115.115822211207811.599199475617197.9029783606529221.615678846378369.7788147628307321.6289077988212411.650493741035521.6449608428404713.665032386779821.6269674600222616.096578538417821.5962647007405818.50915104150772
As you can see these results also show 2 proctors.
The graph will be shown on a sub form, and ProctorID is pretty much what holds everything together.
Now the thing ive noticed is that if you look at the graphs data, the first one shows only the proctor 1 entries. But the second graph shows both.
I also noticed that when i change the following formula to something that doesnt require both table "tblproctrwtrgeh" and "queryproctrproefNEN", it works fine. So i assume it has something to do with the relationship between the table and the query?
Does anyone have any idea what could cause the fact that the 2nd graph keeps showing both proctorID 1 and proctorID2..
Ive tried to adjust the properties of the relationships -- > no luck
Ive tried to make a table wich contains everything from the 2nd query --> no luck..
The only thing that did work was to set the criteria to 1 for the ProctorID
..Anyways, i know this is a lot of information, so if u request some more info or even the database, let me know.
Thank in Advance!