mcmichael13
The Wanna-Be
- Local time
- Today, 00:51
- Joined
- Apr 15, 2009
- Messages
- 50
Hey guys, I'm new to the site and I hope that i may both receive and give any help i can here.
On to the current issue I'm having:
I have created a new database in which the user will input RMA data with various forms. Now, I have been asked to have a "Report Generator" which takes only the RMA's that we have completed and seperates them in Location of RMA (we have several offices), and month completed, then sums the total value of the RMA from that location.
I am doing this with 2 locations right now and I have a query pulling the data based on a "MonthlyRMA" form that specifies the date range, and also the location. When the location combo box is left blank, a "Yes/No" messagebox prompts the user that a blank box will return records for both locations, "yes" proceeds, and "no" cancels the cmd.
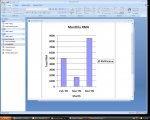
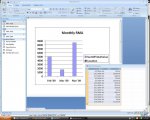
This is all functioning and the query is made exactly how I wanted. The problem comes in when I am creating a bar graph from this query. I cannot get the "Locations" to be displayed as seperate series, instead the x-axis will show the month twice, once for each location. (Attached screenshot "AccessGraph").
I have been learning Access, VBA, and everything else while doing this but i would consider myself a quick learner. The logic of coding makes sense to me, I have just been learning the syntax of how to input the thought correctly.
If anyone has a way to get the bar graph to recognize that the locations are seperate series, that would be awesome.
Thanks so much,
Rob
Query code for Report:
SELECT (Format([DateReceived],"mmm"" '""yy")) AS [Month], Sum([RMA Monthly Query].TotalValue) AS RMAValue
FROM [RMA Monthly Query]
GROUP BY (Format([DateReceived],"mmm"" '""yy")), [RMA Monthly Query].Location, (Year([DateReceived])*12+Month([DateReceived])-1);
Query code for Report Generation based on MonthlyRMA form:
SELECT RMA.DateReceived, RMA.Location, RMA.TotalValue
FROM RMA
WHERE (((RMA.DateReceived) Between [Forms]![MonthlyRMA]![StartDate] And [Forms]![MonthlyRMA]![EndDate]) AND ((RMA.Location)=[Forms]![MonthlyRMA]![Location])) OR (((RMA.DateReceived) Between [Forms]![MonthlyRMA]![StartDate] And [Forms]![MonthlyRMA]![EndDate]) AND (([Forms]![MonthlyRMA]![Location]) Is Null))
ORDER BY RMA.DateReceived;
On to the current issue I'm having:
I have created a new database in which the user will input RMA data with various forms. Now, I have been asked to have a "Report Generator" which takes only the RMA's that we have completed and seperates them in Location of RMA (we have several offices), and month completed, then sums the total value of the RMA from that location.
I am doing this with 2 locations right now and I have a query pulling the data based on a "MonthlyRMA" form that specifies the date range, and also the location. When the location combo box is left blank, a "Yes/No" messagebox prompts the user that a blank box will return records for both locations, "yes" proceeds, and "no" cancels the cmd.
This is all functioning and the query is made exactly how I wanted. The problem comes in when I am creating a bar graph from this query. I cannot get the "Locations" to be displayed as seperate series, instead the x-axis will show the month twice, once for each location. (Attached screenshot "AccessGraph").
I have been learning Access, VBA, and everything else while doing this but i would consider myself a quick learner. The logic of coding makes sense to me, I have just been learning the syntax of how to input the thought correctly.
If anyone has a way to get the bar graph to recognize that the locations are seperate series, that would be awesome.
Thanks so much,
Rob
Query code for Report:
SELECT (Format([DateReceived],"mmm"" '""yy")) AS [Month], Sum([RMA Monthly Query].TotalValue) AS RMAValue
FROM [RMA Monthly Query]
GROUP BY (Format([DateReceived],"mmm"" '""yy")), [RMA Monthly Query].Location, (Year([DateReceived])*12+Month([DateReceived])-1);
Query code for Report Generation based on MonthlyRMA form:
SELECT RMA.DateReceived, RMA.Location, RMA.TotalValue
FROM RMA
WHERE (((RMA.DateReceived) Between [Forms]![MonthlyRMA]![StartDate] And [Forms]![MonthlyRMA]![EndDate]) AND ((RMA.Location)=[Forms]![MonthlyRMA]![Location])) OR (((RMA.DateReceived) Between [Forms]![MonthlyRMA]![StartDate] And [Forms]![MonthlyRMA]![EndDate]) AND (([Forms]![MonthlyRMA]![Location]) Is Null))
ORDER BY RMA.DateReceived;