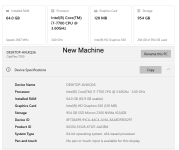
Memory is at 14%, therefore you are NOWHERE near saturation of memory AND at that level, I guarantee you aren't swapping or paging anything. I.e. dynamic memory is not actively load-balancing. In fact, with that small memory load, you probably have only Access itself, an anti-virus, and Windows Task Manager active.
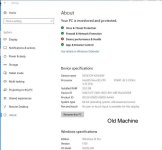
CPU load is at 6%, so you are nowhere near saturating THAT, though it might help to know the CPU load in greater detail. Did you tell us WHICH i7 processor you have? The i7 line of chips has been multi-CPU for years now, but later i7s have split-speed CPUs. That's why I earlier asked if you had been playing around with CPU Affinity. But, you said NO on that. It is still worth knowing what i7 chip you have.
The disk is showing no particular load, zero read usage, and fast write-back speed, though it is taking a hit every 5 seconds. That could be ordinary logging, though there IS a possible resource hog to consider. Does your system have Copilot active? If so,, do you know if you have the RECALL feature active? That might cause a regular periodic load, though the timing doesn't seem right. (RECALL isn't a once-per-5-seconds feature.)
The GPU is not doing much, though when Access is involved, advanced graphics card loads are not expected anyway. Unless you have programmed something using complex graphics API code - and I'm betting against that. You would know if you had done such a thing.
You have a slight level of activity on the Ethernet connection, but since you explained that the app is all on the same machine, the network activity is something probably unrelated to Access. It is probably very low network action, scaled precisely BECAUSE it is so low.
That covers all of the system issues that are the first places to look for bottlenecks. When doing system load analysis, you always look for network issues, then disk problems, then memory problems, then CPU/GPU problems (in that order), but you've got nothing that would even give me a case of hiccups as far as system loads go.
This means that we need to decide what is going on with the application when it is running, 'cause your problem ain't due to a bum system. You said earlier that reports were reasonably fast, but forms were troublesome. What are the forms doing?
Another question, still related to forms: What is the nature of the forms' .RecordSource properties? Do you directly reference a table? Do you have a query that drives the form? Do you have a literal SQL query as a .RecordSource? Are you using a lot of multi-value fields (MVFs)? Is there a very large table involved? Is there a JOIN involved? Do you have a lot of combo or list boxes active?
At the moment, I don't see anything that would trigger an obvious slowdown, though a problem within Access or your app could surely go down that path. It may sound like a negative result, but look at it this way. We still might not know what IS wrong, but we know it isn't a Windows or system hardware problem per se. It has to be in the version of Access, the libraries, or something being done in the forms. So there is at least some elimination of places to look.