Multiple Charts and Unbound fields in single report

Chipster

Registered User.
Local time
Today, 05:23
Joined
Jul 16, 2015
Messages
24
Working on a report that displays multiple pie charts. Each chart is based on a different query. I cannot pull a single query for all charts due to the criteria for each conflicting with each other. Each query is filtered by Fiscal Year based on what I input into my Fiscal Year Filter form. The command button on the FY Filter Form opens the report, set TempVar to the FY field (the criteria for each query), and closed the FY Filter Form. This works as I want it to.

The problem:
I have additional fields I want to show up on the form such as number of completed students (WINGED). This number is based on yet another query where all completed students are counted [WingedCount]. I have tried to write an expression to an unbound field that points at this [WingedCount] field but it does not work. Then, I changed the report's source as the query with the [WingedCount] field. This does work, however this is where I run into an issue

I open my FY Filter Form and type in my criteria and select the open command button. However, now I am asked for the criteria again for each chart on the report.

Needed:
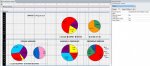
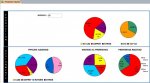
I need a way to input the criteria only once and have all charts populate as well as my count field.

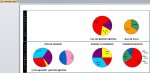
I have attached a jpeg of my current report and will upload jpegs of the needed output following this post.

Thanks for the help
 

Attachments

  • Current Report Output.jpg
    Current Report Output.jpg
    60.3 KB · Views: 175
This jpeg shows the report data source as my count query.

I also tried an unbound field for the Winged Count as
=[Assignment Charts Wingers Count]![WingedCount]
But this does not work.
 

Attachments

  • New Report Design.jpg
    New Report Design.jpg
    86 KB · Views: 148
This is what my final product should look like. Again, once I input my criteria into my Fiscal Year Filter Form, I am prompted for that same input again for each chart in the report.

Thanks again.
 

Attachments

  • New Report Output.jpg
    New Report Output.jpg
    55.7 KB · Views: 151
If you handle the Format event of the report section, you can run any code you want, and access your database during that time for ad hoc data queries. A code example follows . . .
Code:
Private Sub Detail_Format(Cancel As Integer, FormatCount As Integer)
   Me.txtSomeAdHocTextBox = DSum("SomeField", "SomeTable", "RecordID = " & Me.RecordID)
End Sub
hth

Where do I input this code as part of the report properties? Also, can you elaborate on the fields in the code you posted? Which parts do I need to modify for my fields?

To clarify: My count field is generated from a query that counts the number of completed students within the Fiscal Year specified in my Fiscal Year Filter form.
 
You put the code in the module of the report. You handle the format event of the section in which your unbound textbox appears.

I don't know what you need to modify. You have not clearly shown how you calculate or retrieve your Winged Count (or I've missed it). I used DSum() as an example of assigning an ad hoc database value to a control on a report. If you think you want to do something like that, read up on "Access Domain Aggregate Functions," for more specific usage details, but you can also open a recordset in the event handler. The point being: at that time you can do very rich data operations to populate unbound text boxes in a report.

Please let me know if you have further questions.
 
I attempted the code recommended in the report module, but I could not figure out how it works. I did some research on DSum, DCount, etc but I'm not sure this gets me what I wanted.

I got it to work this way:
I added a subreport and based the subreport on my counts query. In the subreport, I placed a single text box based on my counts field and shrunk the subreport to a size that only shows my single text box. I removed the borders of the subreport as well as scroll bars, control box, close button, and min/max buttons. Since all queries in the main report and the query in the subreport are based on the same criteria (the data in my fiscal year filter form) the form loads as I want.

Thanks for all the help and suggestions. If you can think of a better way for me to slice this cake, I am all ears.
 

Users who are viewing this thread

Back
Top Bottom