Wondering if someone can point me in the right direction. I am updating an access db and one of the reports that gets used a lot is for displaying sieve data. I have attached an example of the current charts output here. The chart is an embedded Microsoft Graph 97 Chart and was created by an employee who is no longer here in the late 90's or early 2000's. An issue has been creeping up over the past few years where more and more of our systems output the chart like the second image I have attached, so the formatting of this chart is hit or miss and people are requesting other people to print things for them so it formats correctly. Note the two images are the same report but printed on different computers. I'm assuming it has to do with the Access version, but I don't really have control over which version people get installed on their systems. So I am wondering if anyone has dealt with something like this before, or if anyone has any insight into how I can create a similar chart but with more modern technology so formatting will be better.
From what I can tell though, Access doesn't have anything to easily create the graph I want or at least that I am aware of so wondering if anyone has any idea where I should look. Does access have the ability to generate graphs with additional features through VBA? or is the property sheet and chart settings all there are? or are there other options I may not be aware of?
From what I can tell though, Access doesn't have anything to easily create the graph I want or at least that I am aware of so wondering if anyone has any idea where I should look. Does access have the ability to generate graphs with additional features through VBA? or is the property sheet and chart settings all there are? or are there other options I may not be aware of?
Attachments
-
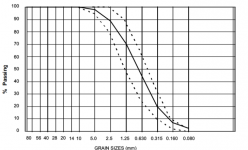 sieve.png48.8 KB · Views: 62
 -
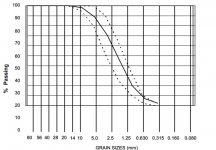 skewed sieve.png54.7 KB · Views: 67