I need both tips and answer.
I have two mean readings received from table in each day (one from morning shift and another from night shift).
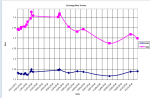
I've plotted a line chart of MEAN over DATE(with criteria:Between [Forms]![ViewReport]![fromDate] And [Forms]![ViewReport]![toDate]). It becomes a ZIG-ZAG shaped line.
However, I want the graph to look like a normal curve line. Like X-bar chart.
Thus, I'm thinking of another field, let say ID. So each data has different ID.
So I plot another graph MEAN over ID (with criteria refering to date selected by user:
Between [Forms]![ViewReport]![fromDate] And [Forms]![ViewReport]![toDate]).
But it does not work.
I don't really mind if the X-value is not in the format of date. But the graph shall display according to user's selection of date range.
Any ideas?
I have two mean readings received from table in each day (one from morning shift and another from night shift).
I've plotted a line chart of MEAN over DATE(with criteria:Between [Forms]![ViewReport]![fromDate] And [Forms]![ViewReport]![toDate]). It becomes a ZIG-ZAG shaped line.
However, I want the graph to look like a normal curve line. Like X-bar chart.
Thus, I'm thinking of another field, let say ID. So each data has different ID.
So I plot another graph MEAN over ID (with criteria refering to date selected by user:
Between [Forms]![ViewReport]![fromDate] And [Forms]![ViewReport]![toDate]).
But it does not work.
I don't really mind if the X-value is not in the format of date. But the graph shall display according to user's selection of date range.
Any ideas?
Last edited: