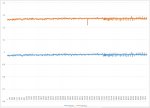
I can not get a line graph inserted into a report by using the Wizard. I have 2 columns of paired data that I want to graph. I dragged the 2 columns to the "Data" control in the wizard and changed summarizing for both columns from "sum" to "none".
When I look at the report in Print Preview, the data points are stacked vertically in the center of the graph and the "Series" box displays what looks like the data. If I add a Date/Time column as the X-axis, I am told that I have to summarize the data, something I don't want to do.
What am I doing wrong??? I've made various selections using the wizard and all fail. I had a co-worker work with me and he could not figure it out either.
Help is appreciated! Thanks in advance for your thoughts and time.

