AccidentalFate
Registered User.
- Local time
- Today, 13:44
- Joined
- Apr 28, 2008
- Messages
- 42
oka i have this chart...
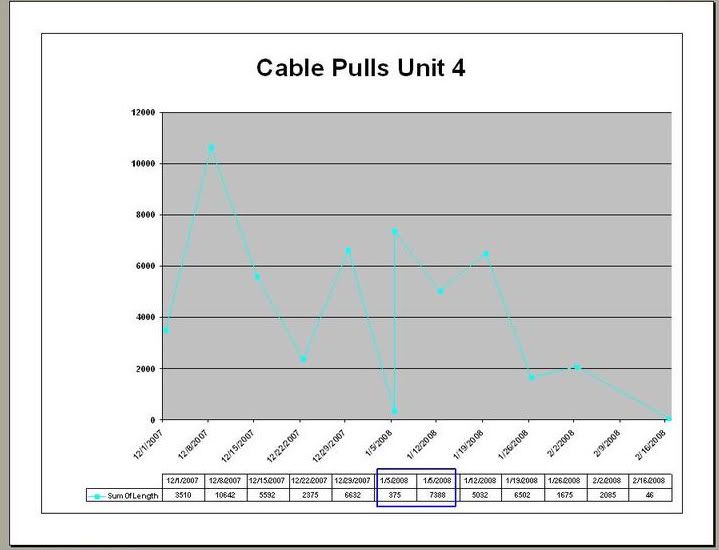
as you can see (in the blue area) i have the same date popping up... i cant seem to figure out why its doing it...
here is the row source for the chart
SELECT ([pulled Date]-Weekday([pulled Date])+7),Sum([Length]) AS [SumOfLength] FROM [Chart Abs 4] GROUP BY (Year([Pulled Date])*CLng(54) + DatePart("ww",[Pulled Date],0)-1),([pulled Date]-Weekday([pulled Date])+7);
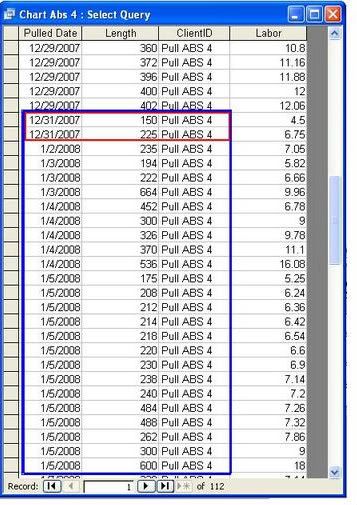
and here is the query where the information was pulled... the red is the first plot on the chart (375) and the blue is the whole week
can anyone help?
as you can see (in the blue area) i have the same date popping up... i cant seem to figure out why its doing it...
here is the row source for the chart
SELECT ([pulled Date]-Weekday([pulled Date])+7),Sum([Length]) AS [SumOfLength] FROM [Chart Abs 4] GROUP BY (Year([Pulled Date])*CLng(54) + DatePart("ww",[Pulled Date],0)-1),([pulled Date]-Weekday([pulled Date])+7);
and here is the query where the information was pulled... the red is the first plot on the chart (375) and the blue is the whole week
can anyone help?