rich.barry
Registered User.
- Local time
- Today, 11:44
- Joined
- Aug 19, 2001
- Messages
- 176
The quickest way of getting my data into a chart is hopefully going to be passing a value list to the RowSource using code.
The problem is, I can't quite work out the syntax for the RowSource property.
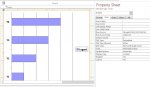
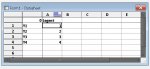
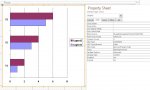
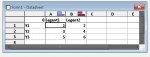
All I want is a bar graph where I sent eg 1;2;3;4 and it plots 4 bars all belonging to the same series.
The closest I can get that seems to work is sending:
rubbish;rubbish;rubbish;1;rubbish;2;rubbish;3;rubbish;4
where I have the column count set to 2 and column heads on. Even then I get 4 series, not 1.
Anyone know the correct way?
Thanks
Richard
The problem is, I can't quite work out the syntax for the RowSource property.
All I want is a bar graph where I sent eg 1;2;3;4 and it plots 4 bars all belonging to the same series.
The closest I can get that seems to work is sending:
rubbish;rubbish;rubbish;1;rubbish;2;rubbish;3;rubbish;4
where I have the column count set to 2 and column heads on. Even then I get 4 series, not 1.
Anyone know the correct way?
Thanks
Richard
")