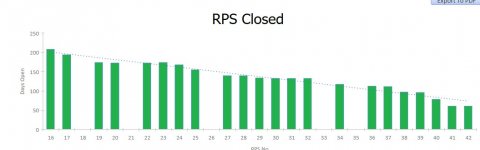
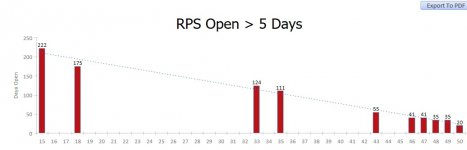
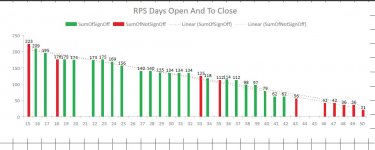
Hi All, hope all is good. I have a question I cant seem to get an answer on and I was wondering if it is possible . I've attached two charts I produce on a database showing cases still open and cases closed. My question is can I combine the two charts into one and keep the formatting i.e. closed results columns stay green and and open columns stay red. I could have a query that returns all but cant see how I could format the chart to show what's open and what's closed
query for open chart :
query for closed chart :
Any feedback on this would be greatly appreciated as always
regards
query for open chart :
Code:
SELECT tblRPS.RPSno, tblRPS.DateRaised, tblRPS.Owner, tblRPS.PartDesc, tblRPS.FailureMode, tblRPS.signoffdate, tblRPS.signoffdate2, tblRPS.signedoff, (Date()-[Dateraised]) AS DaysOpen, tblRPS.Partno
FROM tblRPS
WHERE (((tblRPS.DateRaised)<Date()-5 And (tblRPS.DateRaised)>=Date()-365) AND ((tblRPS.signedoff)=No));
query for closed chart :
Code:
SELECT tblRPS.RPSno, tblRPS.DateRaised, tblRPS.Owner, tblRPS.PartDesc, tblRPS.FailureMode, tblRPS.signoffdate, tblRPS.signoffdate2, tblRPS.signedoff, (Date()-[Dateraised]) AS DaysOpen, tblRPS.Partno
FROM tblRPS
WHERE (((tblRPS.DateRaised)<Date()-5 And (tblRPS.DateRaised)>=Date()-365) AND ((tblRPS.signedoff)=Yes));
Any feedback on this would be greatly appreciated as always
regards