Complicated Record Count...

randallst

Registered User.
Local time
Today, 02:40
Joined
Jan 28, 2015
Messages
64
Hi there,

I'm not 100% sure how and if this is possible, but I think I'm going in too deep with this one at my level of knowledge.

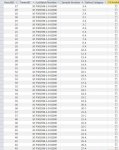
I have a database where I enter sample results. For each batch, we take 30 samples and inspect each sample for faults. Each sample could have multiple faults so we report each fault found and apply a category (A, B or C).

I have a query that counts all the defects in each batch by A, B and C which works fine, but I need to tweak the query to only report each sample once, but with the highest category against it (i.e. Sample 1 [in the attached table image] is reported twice, 1 Category A and 1 Category C. I want the query [in the attached query image] to ignore the C and only count the A).

I'm frazzled on this now, but if someone might have any ideas, it'd be a great help. I have attached a couple of screenshots for reference if it's any help.

All the best
Stuart


Hopefully what I've typed makes sense and thanks in advance :)
 

Attachments

  • table.jpg
    table.jpg
    79.2 KB · Views: 82
  • query.JPG
    query.JPG
    43.4 KB · Views: 75
Last edited:
The main problem I see is that LotBatchNumber should not be stored as one string. Break it up into its parts, and store each part in its own field. ReleaseNumber should be a field, not embedded in that monolithic LotBatchNumber.
hth
Mark
 
...but I need to tweak the query to only report each sheet once

What the hell is a sheet?

In your table I see results, batches, samples and defects, in your post you also use the term fault. Then in describing what you want in your query you metnion this whole new term sheet. No idea what you are talking about with that term. Avoid synonyms when relating your data to us--you get one term per concept otherwise you confuse us.

Perhaps you can demonstrate what you hope to accomplish with data. Using the data in the table image you posted, show me exactly what data you want your query to return. Just to be clear, don't describe what you want, actually show me the data you want your query to return if you were to feed it the data shown in the table.jpg
 
Apologies I totally messed up my question and got to admit it isn't really clear.

I have attached a spread sheet hopefully explaining the requirements, hopefully it helps. I have removed the word 'sheet', that was a typo on my part
 

Attachments

That doesn't readily make sense. The main issue that I am having is why is A reduced by 3 in the expected results? What 3 A values are not suppose to show up?

Also, your data isn't all-inclusive, you really need to work with a better starting sample. I mean, what happens when A & B are defaults in the same sample? Or if all 3 are in a sample?

I am attaching a better sample data set. Please demonstrate what you expect the results of it to be.
 

Attachments

1) Create 3 queries, one for "A", one for "B", and one for "C". Each query would have your ParentID, Lot Batch Number (looks like a mess but I'm guessing there are business reasons for it), sample number, and defect category. A is limited to "A" defects, same with B and C.

From their you can create ONE query that joins the other three to sub-queries, thus giving you a single record that holds the "A,B,C" values.

From there, you can report all defects OR just the highest (using nested IIFs).
 
Last edited:
That doesn't readily make sense. The main issue that I am having is why is A reduced by 3 in the expected results? What 3 A values are not suppose to show up?

Also, your data isn't all-inclusive, you really need to work with a better starting sample. I mean, what happens when A & B are defaults in the same sample? Or if all 3 are in a sample?

I am attaching a better sample data set. Please demonstrate what you expect the results of it to be.


Thank you for laying out the sample data clearer, apologies its not very often I put examples together. I have highlighted the results and tallied them up in the count box (please find attached), I hope this helps. :)
 

Attachments

Please look at the attached. This gives the basic data you are looking for. Please let me know if this approach (queries making your base data, then putting it together as a usable set) will get you where you need to be.
 

Attachments

First find the Max (Min) defect category per sample, then make a crosstab query based on the result.
 

Attachments

Please look at the attached. This gives the basic data you are looking for. Please let me know if this approach (queries making your base data, then putting it together as a usable set) will get you where you need to be.

Mark, absolutely spot on mate! I can understand how you've achieved the result in the end. Apologies for the hard work of explaining what I was looking for, I'll keep this in mind in future. :D
 
First find the Max (Min) defect category per sample, then make a crosstab query based on the result.

Also big thanks to you JHB, I've used your method on another section and works perfectly :)
 
You're welcome, good luck. :)
 
Your very welcome. Often if you can break down these complex queries into simpler steps, it is much easier to not only build but also validate your results. Once you have a basic structure that works, you can start on a more complex version, if needed.
 

Users who are viewing this thread

Back
Top Bottom