I am eventually wanting to create a chart on a report. Im guessing that the points on the chart are determined by the numbers returned in a query?
The Table fields include...
• Enquiry Date
• Quotation Date
I need the query first of all to do a simple sum (quotation minus enquiry) to return the turnaround time. Then I want it to count how many records return 0, how many return 1 and so on.
I also need scope in this query to filter by customer (so that from a form, I can select results only for a specific customer, or choose all customers)
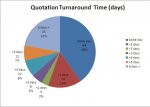
My end goal is to replicate this chart. I have it working perfectly in Excel, because I can write IF functions in hidden columns etc, but im trying to convince everyone that an Access-based quotes system is sooo much better, but of course I need to extract the stats too.
Cheers,
The Table fields include...
• Enquiry Date
• Quotation Date
I need the query first of all to do a simple sum (quotation minus enquiry) to return the turnaround time. Then I want it to count how many records return 0, how many return 1 and so on.
I also need scope in this query to filter by customer (so that from a form, I can select results only for a specific customer, or choose all customers)
My end goal is to replicate this chart. I have it working perfectly in Excel, because I can write IF functions in hidden columns etc, but im trying to convince everyone that an Access-based quotes system is sooo much better, but of course I need to extract the stats too.
Cheers,