danikuper
Registered User.
- Local time
- Today, 01:26
- Joined
- Feb 6, 2003
- Messages
- 147
Hello!
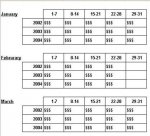
I need to create a report that compares 2002, 2003 and 2004 data by month by week (defined as groupings of 7 days).
I've created a cross-tab query with the data I need but am having trouble with the report... can someone help?
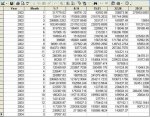
See attached what I mean. The cross_tab_report.jpg is the end result I'm looking for while the cross_tab_query.jpg is the data I have.
I'm not even sure how to start... grouping levels, sorting, etc.?
Thanks so much in advance!")
daniel
I need to create a report that compares 2002, 2003 and 2004 data by month by week (defined as groupings of 7 days).
I've created a cross-tab query with the data I need but am having trouble with the report... can someone help?
See attached what I mean. The cross_tab_report.jpg is the end result I'm looking for while the cross_tab_query.jpg is the data I have.
I'm not even sure how to start... grouping levels, sorting, etc.?
Thanks so much in advance!
daniel