Hi,
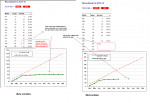
I have attached a stripped down version of my database which holds the dates that patients were enrolled in clinical studies. The requirement is to show the cumulative monthly total in a chart, also including a cumulative target line. Take a look at the report and you'll see I'm 99% of the way there, but with a gap in the results.
The cumulative query is one I have used before in other projects and I think I got it from this forum originally (can't be certain, it was years ago). It works fine most of the time, but a problem arises when there is a gap in the data.
For example, in the attached data, there were no enrollments in November. The query returns the right cumulative totals up to October, leaves November blank and then returns the correct total for December. Therefore, the chart also leaves a gap for November.
Even though the figures shown are correct, I need to get November to show that the cumulative total was the same as in October. The IIf statement in query 3 seems to be the place to change it, but if I’m honest I don’t really follow what it’s doing, so I can’t figure out how to change it.
By the way, I know the format of the "month" field isn't ideal, but I'm pretty much stuck with that as it's imported from elsewhere. I'm actually puzzled as to how Format([Month],"mmm") can convert 2013-01 (which is text) into "Jan", but I'm happy that part works!!")
I’d be grateful for any help.
I have attached a stripped down version of my database which holds the dates that patients were enrolled in clinical studies. The requirement is to show the cumulative monthly total in a chart, also including a cumulative target line. Take a look at the report and you'll see I'm 99% of the way there, but with a gap in the results.
The cumulative query is one I have used before in other projects and I think I got it from this forum originally (can't be certain, it was years ago). It works fine most of the time, but a problem arises when there is a gap in the data.
For example, in the attached data, there were no enrollments in November. The query returns the right cumulative totals up to October, leaves November blank and then returns the correct total for December. Therefore, the chart also leaves a gap for November.
Even though the figures shown are correct, I need to get November to show that the cumulative total was the same as in October. The IIf statement in query 3 seems to be the place to change it, but if I’m honest I don’t really follow what it’s doing, so I can’t figure out how to change it.
By the way, I know the format of the "month" field isn't ideal, but I'm pretty much stuck with that as it's imported from elsewhere. I'm actually puzzled as to how Format([Month],"mmm") can convert 2013-01 (which is text) into "Jan", but I'm happy that part works!!
I’d be grateful for any help.
 I'll see how this report looks in a few weeks when it's time to include January data.