AC5FF
Registered User.
- Local time
- Yesterday, 21:54
- Joined
- Apr 6, 2004
- Messages
- 552
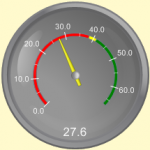
I'm looking for a way to display a percentage on a report. The report currently pulls down the data and displays anywhere from 50%-200%. I would like to put this in more of a graph vs just a number..
Does anyone know if it is possible to create a item like attached picture in Access?
thanks
Does anyone know if it is possible to create a item like attached picture in Access?
thanks