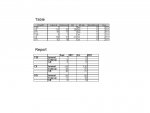
I have a table which captures the monthly headcount by resource type & by department, layout as follows:
DeptID Internal External GR Month MonthNum Year
TSS 7 0 0 Sep 11 2011
CS 115 33 20 Sep 11 2011
DTI 93 11 0 Sep 11 2011
TSS 8 1 0 Oct 12 2011
CS 120 31 21 Oct 12 2011
DTI 92 10 0 Oct 12 2011
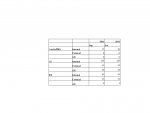
I have difficulty showing the data in a matrix format with DeptID and resource type as row headers and Month as column headers like this:
Sept 2011 Oct 2011
TSS Internal 7 8
External 0 0
GR 0 0
CS Internal 115 120
External 33 31
GR 20 21
DTI Internal 93 92
External 11 10
GR 0 0
I have tried cross tab query and pivot table by exporting the data to Excel but none of these attempts work. As data will be appended to the table every month and I don't really want to change the table structure to include fields for the month (Sept, Oct, Nov ....).
(The enclosed picture shows a better layout of the table & report)
Can any expert on the forum give me a hand?
Thanks a bunch.
DeptID Internal External GR Month MonthNum Year
TSS 7 0 0 Sep 11 2011
CS 115 33 20 Sep 11 2011
DTI 93 11 0 Sep 11 2011
TSS 8 1 0 Oct 12 2011
CS 120 31 21 Oct 12 2011
DTI 92 10 0 Oct 12 2011
I have difficulty showing the data in a matrix format with DeptID and resource type as row headers and Month as column headers like this:
Sept 2011 Oct 2011
TSS Internal 7 8
External 0 0
GR 0 0
CS Internal 115 120
External 33 31
GR 20 21
DTI Internal 93 92
External 11 10
GR 0 0
I have tried cross tab query and pivot table by exporting the data to Excel but none of these attempts work. As data will be appended to the table every month and I don't really want to change the table structure to include fields for the month (Sept, Oct, Nov ....).
(The enclosed picture shows a better layout of the table & report)
Can any expert on the forum give me a hand?
Thanks a bunch.