Hi all,
I'm not quite sure how to graph this, since Excel keeps throwing back errors at me.
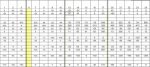
All the values at the top are X values - 1,2,3,4,5,6, etc.
Each value below the X value should be a Y value.
What I want to do is graph each of these values, so in the current example I'd have a scatter plot with 1,0; 1,-8; 1,-53; 1, -52 etc. This should be carried out for each of the X values.
Is it possible for me to graph this without manipulating data? Or is that a pipedream? How do I accomplish what I am trying to do? I don't normally play with the graph features of Excel that often, so I'm slightly befuddled.
I'm not quite sure how to graph this, since Excel keeps throwing back errors at me.
All the values at the top are X values - 1,2,3,4,5,6, etc.
Each value below the X value should be a Y value.
What I want to do is graph each of these values, so in the current example I'd have a scatter plot with 1,0; 1,-8; 1,-53; 1, -52 etc. This should be carried out for each of the X values.
Is it possible for me to graph this without manipulating data? Or is that a pipedream? How do I accomplish what I am trying to do? I don't normally play with the graph features of Excel that often, so I'm slightly befuddled.