You mean as the first record? You'd have to have a sort order that put it at the top, perhaps using a field created for that purpose. I'd probably use column heads or put labels above the listbox.
No. I basically want to cover the very first value in the first column with a rectangle and then text ( a label) but everything seems to end up under the listbox.
Using Bring to Front/Send to Back, which I think is what you're referring to by 'draw order,' won't work here because the Access Gnomes will not allow a Label to prevent the display of data in the manner you're attempting, here. What exactly is you goal here, in covering up the data in the first selection?
Well, I have a table where call data gets entered, part of this data records the issue explained in the call and one column lists the resolution.
There is always an issue for each call, but sometimes there is no resolution yet.
When I create a list with the resolution count, I get them all, including a count of the calls with no resolution thus in the listbox one of the rows has no heading. All I want to do is to add a label that says "Not Resolved Yet" on top of the listbox right were the row heading would be.
Ok, so if nobody knows how to do that, then how can I force that row to have a name? Keep in mind that this is a split db with more than 70.000 entries already...
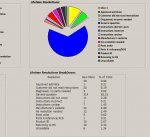
As you can see the graph has a slice called "Slice 1" which is a name given by Access. You can also see the same data having no name in the listbox right under it.
The reason for the lack of name is because there is no default in this field, which should have been "unresolved". The db is split, used by many people and it has many entries now (almost 80.000) so I'd rather not mess with the tables at this point.
The underlying query for the listbox is
Code:
SELECT [Stats SKU Resolution Percent].[ResolutionDetails], [Stats SKU Resolution Percent].[Stats SKU Resolution].[CountOfResolutionDetails], [Stats SKU Resolution Percent].[Expr2] FROM [Stats SKU Resolution Percent] ORDER BY [ResolutionDetails];
This is a bit different from the one used by the graph as the listbox also includes percentages.
Code:
SELECT [ResolutionDetails],Sum([Stats SKU Resolution].[CountOfResolutionDetails]) AS [SumOfStats SKU Resolution_CountOfResolutionDetails] FROM [Stats SKU Resolution Percent] GROUP BY [ResolutionDetails];
It is all done in design mode.
So, how can I have that series, at least in the listbox, be called "unresolved"