Labels in X-Y Graphs (1 Viewer)

jcsuarez

jcsuarez
Local time
Today, 12:52
Joined
Dec 10, 2009
Messages
44
Hi, there.
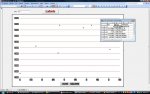
I have to make X-Y graphs with data coming from a query in ACCESS 2003 with Windows Vista. The graph works fine, but I cannot display the Label of each point, without which the graph is useless. Is there any way to make this happen? Help, please!!!
 

ChrisO

Registered User.
Local time
Tomorrow, 01:52
Joined
Apr 30, 2003
Messages
3,202
With a chart called chtDetail and Option Button called optShowPointValues.

Try something like this: -

Code:
Private Sub optShowPointValues_AfterUpdate()

    Me.chtDetail.SeriesCollection(1).HasDataLabels = Me.optShowPointValues

End Sub
 

jcsuarez

jcsuarez
Local time
Today, 12:52
Joined
Dec 10, 2009
Messages
44
Thank you, very much ChrisO for your quick answer. It´s nice to know that we have someone to rely on when our knowledge is not enough. My knowledge is kind of very limiting in this job, and so I tried to follow your instructions but I was unsuccessful so far. Ithink that I am making some kind of mistake with the names, but I can´t find what´s wrong. So I´m attaching two files, so that you can see the names of the variables, etc, and hopefully you can help me out and make your instructions work.
Thanks again for all your help
 

Attachments

  • Cht.jpg
    Cht.jpg
    97.7 KB · Views: 85
  • ChtDesign.jpg
    ChtDesign.jpg
    100.3 KB · Views: 76

ChrisO

Registered User.
Local time
Tomorrow, 01:52
Joined
Apr 30, 2003
Messages
3,202
optShowPointValues needs to be an Option Button and you need to use the AfterUpdate event.

Me.chtDetail.SeriesCollection(1).HasDataLabels = Me.optShowPointValues

Needs to be

Me.TheNameOfYourChartGoesHere.SeriesCollection(1).HasDataLabels = Me.optShowPointValues
 

jcsuarez

jcsuarez
Local time
Today, 12:52
Joined
Dec 10, 2009
Messages
44
Thank you, very much CrisO for your explanations. I tried them, and worked very well. But the Labels that are shown are the values listed in the column "MEDIA", which are the values of the "Y" variable of every point. I need that the program show me the strings listed in the column "ENTRADA" instead. Is there any way that I can do that? Thank you, so much for your help
 

ChrisO

Registered User.
Local time
Tomorrow, 01:52
Joined
Apr 30, 2003
Messages
3,202
You can try: -

Me.TheNameOfYourChartGoesHere.SeriesCollection(2).HasDataLabels = Me.optShowPointValues

But your chart does not show SeriesCollection(2).

Can you please attach a small sample of the actual database?
 

jcsuarez

jcsuarez
Local time
Today, 12:52
Joined
Dec 10, 2009
Messages
44
I´m attaching a small database will all the objects that are needed to display the chart. There are 2 tables, one query and the form with the chart. Hope you can make the miracle. Thank you very much
 

Attachments

  • MyDataBase.mdb
    280 KB · Views: 90

ChrisO

Registered User.
Local time
Tomorrow, 01:52
Joined
Apr 30, 2003
Messages
3,202
I think I need a crash course in Spanish. :(

Anyhow, I’m still making guesses so there is your demo attached that may do what your want.

Hope I’m getting close to what you need.

Regards,
Chris.
 

Attachments

  • MyDataBase.zip
    32.1 KB · Views: 112

jcsuarez

jcsuarez
Local time
Today, 12:52
Joined
Dec 10, 2009
Messages
44
Thank you, so much ChrisO!!!!!!!!!
Works wonderful!!!!!!
It does send an error message sometimes when I change the data source. But it doesn´t always send the error message, and besides, it works fine when you call the form a second time . I was trying to send you the error message anyway, but I wasn´t able to get it lately, so I think I´m better off without it. If I get it again during my (hopefully) long life of successes using your code, I´ll send it to you, I promise.
Well, thanks again for your wonderful help!!!!!
 

jcsuarez

jcsuarez
Local time
Today, 12:52
Joined
Dec 10, 2009
Messages
44
I´m getting the error message more and more, and some points in the chart don´t have the Label they´re supposed to have. The error message I´m getting, translated to my english would be:
Error 1004 in Time of execution. The property Points of Class Series cannot be obtained.
When I push the Debbug button it shows this row of the VB program:
With ChtDetail.Series Collection(1).Points (lng Point Index). DataLabel.Text=strPointName
being the last part (the orange one) with a yellow background
I´m attaching a small file with the Chart and the data source so that you can see the problem. I hope that you can help me avoid this message and get all the Labels in the points represented. Thanks a lot

Juan Carlos
 

Attachments

  • GRAPH.mdb
    452 KB · Views: 80

ChrisO

Registered User.
Local time
Tomorrow, 01:52
Joined
Apr 30, 2003
Messages
3,202
Juan Carlos.

The data returned by the query is inconsistent in as much as some records have no data and I think that should be fixed before the chart will work.

If what you are trying to do is move the horizontal and vertical lines based on their values then there may be another way to do it.
But the query needs to be fixed before proceeding.

And please remember, I don’t speak Spanish so it makes things a little difficult for me. :(

Regards,
Chris.
 

jcsuarez

jcsuarez
Local time
Today, 12:52
Joined
Dec 10, 2009
Messages
44
Hi, Chris! Thanks again for your prompt answer.
I must recognize that you´re right, as usual. I took away both "dummy" series and the graph starts running just like a cheetah!!!
I made those inconsistent Series to draw the lines. The series "FVi de Ft" gives me the vertical line. The other series "MEDIA ECR" draws the horizontal line.
That was my way to solve the "moving around lines" that I told you earlier in another thread. But they´re making trouble in the assignment of the labels. So, if there´s another way of drawing the lines without messing with the labels, I sure will be glad to here from it.
Your spanish may not be good, but you certainly solved a couple of very dificult problems fror me. And I don´t want to know what you think about my english!!!
Well, thanks again Chris. Hope to hear from you soon


Juan Carlos
 

ChrisO

Registered User.
Local time
Tomorrow, 01:52
Joined
Apr 30, 2003
Messages
3,202
G’day Juan Carlos.

>>Your Spanish may not be good<<
My Spanish is neither good nor bad simply because it does not exist. :(

Can you please upload your latest corrected version?

Regards,
Chris.
 

jcsuarez

jcsuarez
Local time
Today, 12:52
Joined
Dec 10, 2009
Messages
44
Hi, Chris. Sorry, it took me a while to answer because I had trouble getting into the forum. I uploaded a copy of the new chart, which works fine, as you can see. Now the problem is that I need 2 lines, one horizontal and one vertical, in different places varying from one dataset to another.
I solved the problem adding two "dummy" series and drawing the lines with them, but that solution causes trouble with the labels for each point. So I took the series out and the Chart runs perfect, with all the labels and no message error. But I still need the lines. What would be the way of drawing one vertical line at 0.79 FVi (independent axis) and a horizontal line at 3450 of the Y axis?
Thank you again, Chris.

Juan Carlos
 

Attachments

  • GRAPH.mdb
    452 KB · Views: 99

ChrisO

Registered User.
Local time
Tomorrow, 01:52
Joined
Apr 30, 2003
Messages
3,202
G’day Juan Carlos.

The dimension of the plot area is derived from a command button behind the Chart.

The lines are positioned relative to the command button.

You will need to get the values of FVi and Rinde Medio from somewhere but they are currently set as FVi = 0.79 and Rinde Medio = 3450.

Hope that helps.

Regards,
Chris.
 

Attachments

  • GRAPH_New.zip
    39.7 KB · Views: 98

jcsuarez

jcsuarez
Local time
Today, 12:52
Joined
Dec 10, 2009
Messages
44
Thanks, Chris. I need those numbers to vary, so I included them in the query which feeds data to the main form. The controls can be seen in the Form in Design View, but they won´t show up in Form View, because I put them the same background and text color than the form background.
I don´t know how to make them vary. I also need the lines in green, if possible. I know you´ll show me how to do all these things. Thanks a lot, Chris,

Juan Carlos
 

Attachments

  • GRAPH_New.mdb
    404 KB · Views: 68

ChrisO

Registered User.
Local time
Tomorrow, 01:52
Joined
Apr 30, 2003
Messages
3,202
G’day Juan Carlos.

A new version is attached.

Hope that helps.

Regards,
Chris.
 

Attachments

  • GRAPH_New_1.zip
    46.5 KB · Views: 70

jcsuarez

jcsuarez
Local time
Today, 12:52
Joined
Dec 10, 2009
Messages
44
Hi, Chris. Thank you very much. The program runs nicely, though it took me a while to figure out how to make it work. Thanks a lot for your help and patience.
Hope to see you or hear from you in the future.


Juan Carlos
 

jcsuarez

jcsuarez
Local time
Today, 12:52
Joined
Dec 10, 2009
Messages
44
Your spanish is getting good!!! :)
But I´m still getting the error message :(. When I radically change the data source, th error message appears again. I´m attaching a new version of the file to see if you can fix it (I´m sure you can). Well, thank you again, Chris. Hope to hear from you soon,

Juan Carlos
 

Attachments

  • GRAPH2.zip
    116.9 KB · Views: 70

Users who are viewing this thread

Top Bottom