I am trying to graph 2 series of data the each pull from different queries onto one chart. Access makes it difficult to have two different queries as two different series on the same graph. Is there a way I can combine these two different criterias for on the same query.
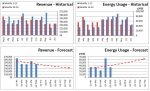
So for each month, there will be 2 fields of data, one field is 1-12 Months, and the second field is 13-24, any ideas so I can graph it like this?
So for each month, there will be 2 fields of data, one field is 1-12 Months, and the second field is 13-24, any ideas so I can graph it like this?