Pie chart in a form

MarionD

Registered User.
Local time
Today, 08:57
Joined
Oct 10, 2000
Messages
425
Hi all,

Hope someone can help me out here. New ground for me!

I have a small application for booking cars into a Garage.
Tbl_Bookings:
Date in: 6.8.2013
Brief: Full Service
Approx. time: 4 hrs

Next car : 6.8.2013
Brief : Brake pads
Approx. time: 2 hrs.

Workshop capacity on any day -16 hrs.

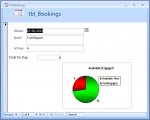
Now my customer would like to look at a pie Chart, per date, showing 16 hrs green and 6 hrs red, so that if he can see at a glance if he still has capacity for more cars on any certain day
I can insert a Chart, but not sure how to make it do what I want. Any help would be much appreciated.

Marion
 
A sample database is attached.

  1. A Unbound Textbox is added on the Form to summarize allocated hours for day, with the DSum() Function.
  2. A Query (QryBooking) is created (for Chart) to summarize allocated hours.
  3. A Temporary Table (tmp_Bookings) holds the Allocable Total Value.
  4. Data in both QryBooking and the tmp_Bookings Table are combined in a Union Query (QryPieChart) and used as Source Data for the Chart on the Form.

Method of Creating the Chart:

  1. The Main Form (now without a pie chart) kept open with the sample data to refresh the underlying query to gather data.
  2. Opened a separate blank form in Design view and created the pie chart using QryPieChart as source.
  3. Done proper formatting of the chart.
  4. Copied the Chart Object into Clip Board.
  5. The Main Form view changed to Design view.
  6. Pasted the Chart Object on it from Clip board.
 

Attachments

Thank you so very much for the time and trouble you have taken!
It's such a good feeling to know that there are people like you out there!

I will spend the whole afternoon trying to put into practice what you have explained and will let you know how I get on!

Marion
 
I can not open the attachment by Apr Pillai, which is a pity because they are usually very good.

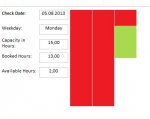
So I’m just going to go with the assumption that the Form should show a summary of one week of bookings, in the style of a continuous Form. This is not a continuous Form but, hopefully, it looks like it.

Please note:
In this demo there is a heavy reliance on Stephen Lebans image class as a drawing surface for the Pie draw. I reduced Stephen’s original code a lot but I hope I didn’t overstep the mark as far as his copyright notice goes.

In any case, it’s just a possible alternative solution.

Attached is an Access2003 demo.

Chris.
 

Attachments

Hi Chris and thank you so much for the reply! I really like the week view!
Because I really like to understand what's happening I will take a bit of time to try and decipher the code. I have opted for an "easy way out" for a quick fix and have inserted 48 unbound fields representing half an hour each. Works quite well and customer happy for the moment, but will definite need the pie chart in the future. Thanks to both of you for the help!
 

Attachments

  • sniptool.JPG
    sniptool.JPG
    19.9 KB · Views: 78
Sorry MarioD, I was away and didn't see your post.

The Database in Access2003 format is attached.

Screenshot of the form is also attached.
 

Attachments

Last edited:
Thanks so much!

I am still working on it!

Have had a few days holiday.

Marion
 

Users who are viewing this thread

Back
Top Bottom