I have a pivot chart that has site locations, and hours on the bottom, and then count of records with each site. Which is how many people used this site during this time for each bar. My problem is when I generate my pivot chart, every single time I have to fix the scale on the right hand side because it has decimal points in it. They only appear when I add dates/times to it. I can fix it when manually each time, the problem is, I want to give this to my boss that has access runtime, so all he has to do is click the button to get the chart and then print or send it off. How do I get rid of those decimal points when the report is generated?
Attachments
-
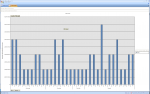 Pivot Chart.PNG82.1 KB · Views: 72