pivot chart

mana

Registered User.
Local time
Today, 15:27
Joined
Nov 4, 2014
Messages
265
Hi

i have another question
do you know it?
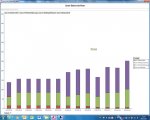
i have a chart with four fields in data area and i want that the scale would be set based on the most value of these four fields
do you know how to do this?
and also can i have a dropdown to choose just one of these fields to show?
i mean i want to see just one chart from these four charts. is ti possible?
thank you
i attached the picture
 

Attachments

  • Unbenannt (1).jpg
    Unbenannt (1).jpg
    78.4 KB · Views: 71
Assuming you have the chart on a form, you should make some room on the form for an option group box where you can click on one, two, three or all four data types. Put a go button next to the options that would delete all records from the temporary table supplying the chart, and re-run the query to populate the table with just the selected data types.

To modify a chart, open the form in design mode and right click on the chart. Select Chart Object and Edit. A whole new application opens up giving you access to everything you need to deal with charts. Now, you want to set the Y axis, mouse over the numbers on the Y axis and right click and select Format Axis. You can enter minimum, maximum and step units there. But you are changing the graph values, so a max for all four data types will not look good if you select only one later on, so my suggestion is to let Access pick the values based on what is in the temp table; it's pretty accurate. Otherwise check off the boxes and enter a value. If you want to code the min, max, step, write back and I will look it up. You can do a max value off the temp table and set the chart value to that, but Access kind of does that for you.
Hope that helps.
 
hello
thank you very much for the answer
it helped

but for the first part:
Assuming you have the chart on a form, you should make some room on the form for an option group box where you can click on one, two, three or all four data types. Put a go button next to the options that would delete all records from the temporary table supplying the chart, and re-run the query to populate the table with just the selected data types.

i didn't get it correctly. can you explain it more please what i exactly do??
thank you


Well, you can put charts on forms and display them like any other types of data. You can also put them on reports too. You did not mention "where" the chart is, so I assumed on a form. And what I meant was you could size the chart 3 inches by 3 and the form 3 inches by 4 and you would have an inch of room to put in an option group box. Then you select the data types, hit go, and the chart is re-drawn.
 

Users who are viewing this thread

Back
Top Bottom