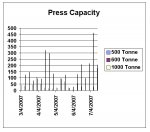
I have a database and have a report which shows a chart, showing hours used(y-axis) per week (x-axis). I used the basic chart wizard to get it set-up, however the dates along the x-axis are formatted as ww and I'm unsure how to convert them to mmm dd, yyyy format. Everything I've tried so far has not worked. Here is the current (Default) SQL that was generated to create the graph :
SELECT (Format([Dates],"WW 'YY")) ,Sum([press500]) AS [500 tonne],Sum([press600]) AS [600 Tonne],Sum([press1000]) AS [1000 Tonne] FROM [Tmp] GROUP BY (Year([Dates])*CLng(54) + DatePart("ww",[Dates],0)-1), (Format([Dates],"WW 'YY"));
This displays the bar chart properly, however the dates along the x-axis are in format of week number. Such as Jan. 01, 2007 would show as 1 '07.
Any and all help would be appreciated, I have searched all over the internet and have found nothing of help.
Thanks
Mark
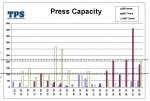
")
