zeroaccess
Active member
- Local time
- Today, 18:42
- Joined
- Jan 30, 2020
- Messages
- 670
Hey all,
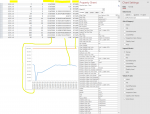
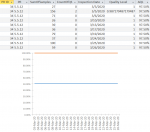
I have quality data that is calculated in the aggregate and can be queried over a specified time period. For example, quality was 97.50% for the period of March 1 to March 31 using a simple formula of ([Pieces]-[Defects])/[Pieces]. I do not store the results of those calculations. If I wanted to chart a quality level at each point in time, how should I set up the data structure? I need it to be for only 1 product at a time. I imagine the X axis being time and Y being the quality level. I have a query that gives me everything except the points in time.
I have quality data that is calculated in the aggregate and can be queried over a specified time period. For example, quality was 97.50% for the period of March 1 to March 31 using a simple formula of ([Pieces]-[Defects])/[Pieces]. I do not store the results of those calculations. If I wanted to chart a quality level at each point in time, how should I set up the data structure? I need it to be for only 1 product at a time. I imagine the X axis being time and Y being the quality level. I have a query that gives me everything except the points in time.
Last edited: