majid.pervaiz
Registered User.
- Local time
- Today, 06:08
- Joined
- Oct 15, 2012
- Messages
- 110
Dear Expert Friends,
I am done with my application, and my management would like to have charts also which I am yet unable to do since I have so much filtering such as year-wise, request type, SLA met or Not Met.
I have a query which extract the information by taking year as an input from the user such as 2016 (screenshot attached). And based on this query I have prepared a report (screenshot attached), now I need to prepare the chart for same.
Following way the chart should appear:
1. User should enter a year to view the chart
2. The bar chart should for each task type should show 2 bars (SLA Met and another for SLA Not Met)
please help me with this.
Attachments
-
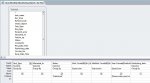 SLA Query By Year.jpg80.6 KB · Views: 47
 -
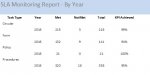 New Picture (5).jpg18 KB · Views: 49