Creating a report with horizontal and vertical details

fortwrestler

Registered User.
Local time
Today, 11:54
Joined
Jan 15, 2016
Messages
50
So,
I'm trying to find the best way to do this, and I've been successful to an extent.

I'm trying to create a report which has a certain piece of equipment, lists a few fields for each, which are then populated according to the date. Right now, i can get this format

Line 1
Date 1
x #
y #
z #
Date 2
x #
y #
z #
Line 2
Date 1
x #
y #
z #
Date 2
x #
y #
z #

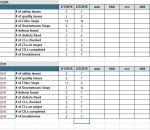
Where as I would like the below format

Line 1
D1 D2 D3 D4 D5 D6 D7
x # # # # # # #
y # # # # # # #
z # # # # # # #

Line 2
D1 D2 D3 D4 D5 D6 D7
x # # # # # # #
y # # # # # # #
z # # # # # # #

I've played around with creating a cross tab query for this, but have been unsuccessful and I'm not sure if that query fits what I want to do. I've seen references to creating a string to store the data for each day as a whole, but I'm not sure if thats the correct way to go either.

Is this possible to do in a report?
 
When I want to pivot data I move to Excel--easier and more robust. With that said, you can get your report like you want with a Cross-tab.

In the query, your Lines and letters would become row headings, the # would become values and the dates would become column headings. Then in the report you would have groupings for your lines.
 
With the crosstab in this case, how would I create the # as a value. This number is directly autopopulated from a table
 
Here's the actual data i am looking for (everything is off center)

Line
EQ5A
1/1/2016 1/2/2016 1/3/2016 1/4/2016 1/5/2016 1/6/2016 /7/2016
# of safety issues 0 0 0 0 0 0 0
# of quality issues 14 0 1 0 0 0 0
# of filler stops 53 14 22 0 0 0 0
# of boxing stops 13 31 100 0 0 0 0
# defects found 3 4 2 0 0 0 0
# of defects fixed 4 3 2 0 0 0 0
# of CLs checked 32 32 32 0 0 0 0
# of CLs on target 32 32 32 0 0 0 0
# of CILs completed 22 25 21 0 0 0 0
# of breakdowns 0 0 0 0 0 0 0

EQ5B
1/1/2016 1/2/2016 1/3/2016 1/4/2016 1/5/2016 1/6/2016 /7/2016
# of safety issues 0 0 0 0 0 0 0
# of quality issues 0 0 0 0 0 0 0
# of filler stops 37 33 40 0 0 0 0
# of boxing stops 21 24 28 0 0 0 0
# defects found 7 6 5 0 0 0 0
# of defects fixed 3 0 4 0 0 0 0
# of CLs checked 32 22 32 0 0 0 0
# of CLs on target 32 22 31 0 0 0 0
# of CILs completed 20 21 21 0 0 0 0
# of breakdowns 0 0 0 0 0 0 0

Where I have one table that stores the STOPS(filler/boxing) and another which stores the rest of the items combined into a single combined query.
 
Last edited:
I'm lost. There's no dates in there.

what does the data in our table look like? Provide table and field names please.
 
The dates are across the top(by line, just poor formatting)....
I'm working on getting the second request fulfilled
 
I agree with plog. How about giving us an overview - in pain English - of what you are trying to do. Then give give us some sample data, and a mock up of the desired output.
 
Initially,
I have three tables. One table stores the name of each piece of equipment(constant, same as Filler) amount of stops(broken up into 30+ sub reasons- reasons are constant), and a third table that asks for safety/quality/defects/CLs/CILscompleted (these are in columns, linked to the equipment)

I then have a query which combines all the stops(differentiating between Filler and Boxing).

Then, I have a query which pulls the stop data and the safety/quality/etc into one larger query. This is sorted by line and date.

This final query is the one I'm trying to put into table format.
 
You said you tried a cross tab, what was wrong with it? what was the SQL for it?
 
So the sample data would be as follows


Form 1 :

Filler = EQ5A
Date = 1/1/16

StopFillerSubreason1 - ENTERED
StopFillerSubreason2 - ENTERED
StopFillerSubreason3 - ENTERED

StopBoxingSubreason1 - ENTERED
StopBoxingSubreason2 - ENTERED
StopBoxingSubreason3 - ENTERED

Quality Stops - ENTERED
Safety Stops - ENTERED
etc... - ENTERED
- - ENTERED
- - ENTERED
Etc, end - ENTERED


So all of the above is one form. The Stop section populates one table, while the quality/safety populates another (both carry over Filler and Date).

I sum up the sub reasons by Filler/Boxing, then recombine into 1 query
 
You said you tried a cross tab, what was wrong with it? what was the SQL for it?

I'm having an issue with what to include for the VALUE.

Also, my x,y,z (ie, quality/safety/etc) are populating across rather than down. Is this because I should list x,y,z in a single table
 
Sorry for all the questions, I am newer to Access and am probably trying to create a database beyond my understanding.
 
I need data from your table, not form. So, in your next post give me 2 sets of data:

A. Starting sample data from your table(s). Include table and field names and enough data to cover all cases.

B. Expected Result. Show me what you expect the report to show based on the data in A.
 
Sorry, I deleted all of it because i didn't like the way my tables were setup.


A.
See Picture 1 ( Table - Production Summary Table)
See Picture 2 ( Query - TotalStopsPerDayByArea ) - this query is combined data from other items, just summed up by day and area

B.
So I want to summarize these two tables (which I have successfully done, see Picture 3)

So, working with Picture 3,
I would like to have a report that is displayed in this "excel" format.
Picture 4 - Note, I understand that I may not get the borders and everything but just trying to get that friendly layout
 

Attachments

  • Table 1.PNG
    Table 1.PNG
    10.8 KB · Views: 107
  • Table 2.PNG
    Table 2.PNG
    5.2 KB · Views: 120
  • Query 3.PNG
    Query 3.PNG
    13.9 KB · Views: 110
  • Report.PNG
    Report.PNG
    25.4 KB · Views: 119
I can't really help you--your table is set up improperly. You shouldn't be storing data values as field names. ClChecked, ClonTarget, SafetyIssues, etc. should be values in a table, not fields. Your Production Summary Table, shouldn't have 11 fields, it should have 5:

ID, entryDate, Line, IssueType, Issues
1, 2/1/2016, EH1, CLChecked, 2
2, 2/1/2016, EH1, CLonTarget, 2
3, 2/1/2016, EH1, SafetyIssues, 2
...
31, 2/2/2016, EQ5A, CILsComplete, 6
32, 2/2/2016, EQ5A, Breakdowns, 7

You get your data into that and you can then generate the reports you want via cross-tab.
 
Makes sense and seems easy to do. Should I have a table with all the issues under one column?

Also, is the query for the stops valid ?

Like I said I'm newer to access and it's all a learning process for me so thanks for all of your help so far
 
Queries pull together data, so if it produces the results you need, its right. That doesn't mean the underlying tables are correct. What's the SQL of the query?
 
I don't understand the question.
 
You asked for the SQL of my Query....I wasn't sure if you wanted the query from picture 1 or picture 2 from the previous post....Here are both

Picture 1

SELECT qry_02_TotalStopsPerDayDownstream.Line, qry_02_TotalStopsPerDayDownstream.EntryDate, qry_02_TotalStopsPerDayDownstream.DownStops, qry_02_TotalStopsPerDayFiller.FilStops

FROM qry_02_TotalStopsPerDayFiller INNER JOIN (qry_02_TotalStopsPerDayDownstream INNER JOIN [Production Summary Table] ON (qry_02_TotalStopsPerDayDownstream.[EntryDate] = [Production Summary Table].[EntryDate]) AND (qry_02_TotalStopsPerDayDownstream.[Line] = [Production Summary Table].[Line])) ON (qry_02_TotalStopsPerDayFiller.[EntryDate] = [Production Summary Table].[EntryDate]) AND (qry_02_TotalStopsPerDayFiller.[Line] = [Production Summary Table].[Line]);

Picture 2

SELECT [Production Summary Table].EntryDate, [Production Summary Table].Line, [Production Summary Table].CLChecked, [Production Summary Table].CLonTarget, [Production Summary Table].SafetyIssues, [Production Summary Table].QualityIssues, [Production Summary Table].DefectsFound, [Production Summary Table].DefectsFixed, [Production Summary Table].CILsCompleted, [Production Summary Table].Breakdowns, qry_02_TotalStopsPerDayByArea.FilStops, qry_02_TotalStopsPerDayByArea.DownStops

FROM qry_02_TotalStopsPerDayFiller, qry_02_TotalStopsPerDayDownstream, [Summary Constants], [Production Summary Table] INNER JOIN qry_02_TotalStopsPerDayByArea ON ([Production Summary Table].Line = qry_02_TotalStopsPerDayByArea.Line) AND ([Production Summary Table].EntryDate = qry_02_TotalStopsPerDayByArea.EntryDate)

GROUP BY [Production Summary Table].EntryDate, [Production Summary Table].Line, [Production Summary Table].CLChecked, [Production Summary Table].CLonTarget, [Production Summary Table].SafetyIssues, [Production Summary Table].QualityIssues, [Production Summary Table].DefectsFound, [Production Summary Table].DefectsFixed, [Production Summary Table].CILsCompleted, [Production Summary Table].Breakdowns, qry_02_TotalStopsPerDayByArea.FilStops, qry_02_TotalStopsPerDayByArea.DownStops;
 

Users who are viewing this thread

Back
Top Bottom