You are using an out of date browser. It may not display this or other websites correctly.
You should upgrade or use an alternative browser.
You should upgrade or use an alternative browser.
Creating a report with horizontal and vertical details
- Thread starter fortwrestler
- Start date
fortwrestler
Registered User.
- Local time
- Today, 04:52
- Joined
- Jan 15, 2016
- Messages
- 50
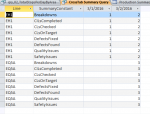
I can't really help you--your table is set up improperly. You shouldn't be storing data values as field names. ClChecked, ClonTarget, SafetyIssues, etc. should be values in a table, not fields. Your Production Summary Table, shouldn't have 11 fields, it should have 5:
ID, entryDate, Line, IssueType, Issues
1, 2/1/2016, EH1, CLChecked, 2
2, 2/1/2016, EH1, CLonTarget, 2
3, 2/1/2016, EH1, SafetyIssues, 2
...
31, 2/2/2016, EQ5A, CILsComplete, 6
32, 2/2/2016, EQ5A, Breakdowns, 7
You get your data into that and you can then generate the reports you want via cross-tab.
So,
I redid my tables to match the above and appropriate forms.
I'm trying to recombine the data in the Crosstab now, but I'm having an issue pulling in Filler Stops/Downstream Stops. Theoretically, those two issues could fall under the same Field Name as the ones above (but they are auto-calculated from a sum of other inputs).
Here's the SQL of my current crosstab(Doesn't include Filler/Downstream Stops)
TRANSFORM First(qry02_SummaryOfOther.NumberOfSummary) AS FirstOfNumberOfSummary
SELECT qry02_SummaryOfOther.Line, qry02_SummaryOfOther.SummaryConstant
FROM qry_02_TotalStopsPerDayByArea INNER JOIN qry02_SummaryOfOther ON (qry_02_TotalStopsPerDayByArea.EntryDate = qry02_SummaryOfOther.EntryDate) AND (qry_02_TotalStopsPerDayByArea.Line = qry02_SummaryOfOther.Line)
GROUP BY qry02_SummaryOfOther.Line, qry02_SummaryOfOther.SummaryConstant
PIVOT qry02_SummaryOfOther.EntryDate;
You didn't post any questions.
If you need help getting a query to give you the data you want, I would need 2 things:
A. Sample starting date from your tables. Include table and field names and enough sample data to show all cases.
B. Expected results. Based on the data in A, show me exactly what date you expect your query to produce.
fortwrestler
Registered User.
- Local time
- Today, 04:52
- Joined
- Jan 15, 2016
- Messages
- 50
Sorry, I didn't phrase it as a question....
How do I combine the Issues Summary to include the Filler Stops and Downstream Stops under the same Row Heading? Or should I do this in a report?
Pictures Attached
How do I combine the Issues Summary to include the Filler Stops and Downstream Stops under the same Row Heading? Or should I do this in a report?
Pictures Attached
Attachments
Again, 2 sets of data. What you have and what you want to end up with. And identify them. You posted 4 random things and added arrows to one of them. I have no clue what you are trying to accomplish.
A. Sample starting date from your tables. Include table and field names and enough sample data to show all cases.
B. Expected results. Based on the data in A, show me exactly what date you expect your query to produce.
A. Sample starting date from your tables. Include table and field names and enough sample data to show all cases.
B. Expected results. Based on the data in A, show me exactly what date you expect your query to produce.
fortwrestler
Registered User.
- Local time
- Today, 04:52
- Joined
- Jan 15, 2016
- Messages
- 50
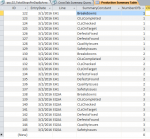
A.
Production Summary Table - The List of Issues
Stops By Area Query - Filler Stops and Downstream Stops.
These two would be the sampling data.
B.
Current Result = CrossTab Query
Expected Result = Target CT Query
Is that what you are asking for?
I want to combine the two tables from A into a single query which is grouped by Line, Issue/FillerStop/DownstreamStop, Date
Not really. I understand that I now have A. But I don't think you've given me B. I mean, if you have a query that produces the expected results(CrossTabSummaryQuery), then you have what you need.
If you don't have B, show me what data you expect to be shown in B, based on A.
If you don't have B, show me what data you expect to be shown in B, based on A.
fortwrestler
Registered User.
- Local time
- Today, 04:52
- Joined
- Jan 15, 2016
- Messages
- 50
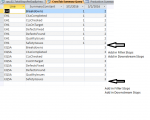
I partially have B.
Right now, the crosstab query is only pulling from part 1 of Table A. I'd like to have a query which combines the two(A and B)
This may not even be possible....
The picture is an example of what I'm looking for in a cross tab query
Right now, the crosstab query is only pulling from part 1 of Table A. I'd like to have a query which combines the two(A and B)
This may not even be possible....
The picture is an example of what I'm looking for in a cross tab query
Attachments
It probably is possible, but I still think you might have an issue with your structure. Whats the SQL of the StopsByArea query? In there you have values that should be in fields stored in field names (FilStops & DownStops).
I think you might need to restrucutre another table, or hopefully, just reconfigure that query. What's the SQL of that query?
I think you might need to restrucutre another table, or hopefully, just reconfigure that query. What's the SQL of that query?
fortwrestler
Registered User.
- Local time
- Today, 04:52
- Joined
- Jan 15, 2016
- Messages
- 50
Well, The query is a query of a query...but I will post them and try to explain.
Query 1 : TotalStopsPerDayArea
SELECT qry_02_TotalStopsPerDayDownstream.Line, qry_02_TotalStopsPerDayDownstream.EntryDate, qry_02_TotalStopsPerDayDownstream.DownStops, qry_02_TotalStopsPerDayFiller.FilStops
FROM qry_02_TotalStopsPerDayFiller INNER JOIN (qry_02_TotalStopsPerDayDownstream INNER JOIN [Production Summary Table] ON (qry_02_TotalStopsPerDayDownstream.[EntryDate] = [Production Summary Table].[EntryDate]) AND (qry_02_TotalStopsPerDayDownstream.[Line] = [Production Summary Table].[Line])) ON (qry_02_TotalStopsPerDayFiller.[EntryDate] = [Production Summary Table].[EntryDate]) AND (qry_02_TotalStopsPerDayFiller.[Line] = [Production Summary Table].[Line])
GROUP BY qry_02_TotalStopsPerDayDownstream.Line, qry_02_TotalStopsPerDayDownstream.EntryDate, qry_02_TotalStopsPerDayDownstream.DownStops, qry_02_TotalStopsPerDayFiller.FilStops;
Query 2 : TotalStopsPerDownstream
SELECT [Stop Tracker Table2 Query].Line, [Stop Tracker Table2 Query].EntryDate, Sum([Stop Tracker Table2 Query].TotalStopsForDay) AS DownStops
FROM [Stop Tracker Table2 Query]
WHERE ((([Stop Tracker Table2 Query].Reason) Not Like "*_Filler")) OR ((([Stop Tracker Table2 Query].Reason) Like "*_Drop Case L2")) OR ((([Stop Tracker Table2 Query].Reason) Like "*_Drop Caser"))
GROUP BY [Stop Tracker Table2 Query].Line, [Stop Tracker Table2 Query].EntryDate;
Query 3 : TotalStopsPerDayFiller
SELECT [Stop Tracker Table2 Query].Line, [Stop Tracker Table2 Query].EntryDate, Sum([Stop Tracker Table2 Query].TotalStopsForDay) AS FilStops
FROM [Stop Tracker Table2 Query]
WHERE ((([Stop Tracker Table2 Query].Reason) Like "*_Filler" Or ([Stop Tracker Table2 Query].Reason) Like "*_Drop Case L2" Or ([Stop Tracker Table2 Query].Reason) Like "*_Drop Caser"))
GROUP BY [Stop Tracker Table2 Query].Line, [Stop Tracker Table2 Query].EntryDate;
Query 4 : StopTrackerTable2 Query (This is the summation of all stops)
SELECT [Stop Table Tracker].Line, [Stop Table Tracker].EntryDate, [Stop Table Tracker].Reason, [Stop Table Tracker].NumOnDays, [Stop Table Tracker].NumOnNights, Nz([NumOnDays])+Nz([NumOnNights]) AS TotalStopsForDay
FROM [Stop Table Tracker];
So,
I couldn't find a way to split it into Filler and Downstream on a single query, nor could I figure out how to sum the total for each. That is why there are 4 queries.
Ultimately, I was thinking I could add Filler and Downstream onto my table with the CILs, Quality, Safety, etc issues, but since it is calculated and not direct input I couldn't figure out how to get it to work properly. It would make things simpler, but I'm unsure how to.
Ok, let's stop on what we were doing and fix that rat's nest. First, what's the difference between the data in Stop Table Tracker and Production Summary Table? Could those datasets be merged?
Second, give me A & B or what you just posted.
A. Show me starting sample data from Stop Table Tracker. Include field names and enough sample data to cover all cases.
B. Show me what data you expect TotalStopsPerDayArea to show when you supply it data from A.
Second, give me A & B or what you just posted.
A. Show me starting sample data from Stop Table Tracker. Include field names and enough sample data to cover all cases.
B. Show me what data you expect TotalStopsPerDayArea to show when you supply it data from A.
fortwrestler
Registered User.
- Local time
- Today, 04:52
- Joined
- Jan 15, 2016
- Messages
- 50
First, I want to say sorry about all this confusion...maybe I started off with too complex a project.....
Anyways
1) The difference between Stop Tracker Table and Production Summary Table
The Stop Tracker table is a detailed database of any given stop on any line. The main input on this summary is the number of stops (day and night separate). This turns into a calculated expression.
The Production Summary Table is a tracker of other items tracked daily on each line(day and night combined). This is not a calculated field.
I don't see how I could combine these due to the way the following items are calculated....
A.
Stop Tracker Table(LAYOUT)
Field names - Line, Entry Date, Reason, Num on days, Num on Nights
Line : Primary Key in separate Table, selected by user
Entry Date : User Entered
Reason : Primary Key in separate Table, selected by user
Num on Days : User Entered
Num on Nights : User Entered
(SAMPLE DATA)... two different fillers, 2 different dates for single filler
Line: EH1
Entry Date : 1/1/16
Reason : Filler
Num on Days :3
Num on Nights : 5
Line: EH1
Entry Date : 1/1/16
Reason : Caser
Num on Days :4
Num on Nights : 8
Line: EQ5A
Entry Date : 1/1/16
Reason : Filler
Num on Days :3
Num on Nights : 5
Line: EQ5A
Entry Date : 1/1/16
Reason : Sealer
Num on Days :3
Num on Nights : 2
Line: EH1
Entry Date : 1/2/16
Reason : Filler
Num on Days :4
Num on Nights : 53
B.
So for reporting purposes, I'm mainly interested in seeing how many stops per certain 'area' per day. Other reports will be used but not on a daily basis. Each reason falls within a certain 'area' ( IE, Filler, and others --- Upstream....and caser, Sealer(and others) --- Downstream). I have sorted this using a filter criteria (LIKE/NOT LIKE).
To achieve this, I use 4 queries. The first query pulls all of the data from the Stop tracker table. then one query filters the "Upstream" and another "Downstream" and SUMS by date and Line. The fourth query combines these two summed queries by date and line, thus production a single liner for each date by each line....
So off data above(should be horizontal, but vertical is easier to read)
EH1
1/1/16
Upstream - 8
Downstream - 12
EQ5A
1/1/16
Upstream - 8
Downstream - 5
EH1
1/2/16
Upstream - 4
Downstream - 53
C. As an end result, I want to take the above results in B and add in the data from production summary table. This is what we review daily.
IE> FILLER > DATE > UPSTREAM > DOWNSTREAM> Production Summary FIELDS
I hope that answers all of your questions.
Once again, thanks for all of the help you are providing. I'm learning alot as I go.
I attached the Database in case you wanted to look over that and if I'm not fully answering your question. Note that the data is all made up and is solely for testing purposes. Dealing with the qry_02 files, I tried hiding the other unrelated ones
Attachments
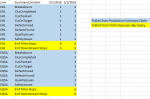
Horizontal makes everything easier to digest:
A:
Line, EntryDate, Reason, NumOnDays, NumOnNights
EH1, 1/1/2016, Filler, 3, 5
EH1, 1/1/2016, Caser, 4, 8
EQ5A, 1/1/2016, Filler, 3, 5
EQ5A, 1/1/2016, Sealer, 3, 2
EH1, 1/2/2016, Filler, 4, 53
B:
EH1, 1/1/2016, 8, 12
EQ5A, 1/1/2016, 8, 5
EH1, 1/2/16, 4, 53
The problem is you still have your table improperly structured. You are storing relevant data in field names (NumOnDays/NumOnNights). The Days/Nights portion should be a field in your table and then each record should be 2 records (one to hold Days and one to Hold Nights). You do that you can use the SUM function.
Also, you are missing a table. You need a table to sort out your Upstream/Downstream values. It seems its keyed off the Reason field, so you need to set up which Reasons go to Upstream/Downstream in a table.
Once you do those 2 things, this query becomes pretty simple.
fortwrestler
Registered User.
- Local time
- Today, 04:52
- Joined
- Jan 15, 2016
- Messages
- 50
Horizontal makes everything easier to digest:
The problem is you still have your table improperly structured. You are storing relevant data in field names (NumOnDays/NumOnNights). The Days/Nights portion should be a field in your table and then each record should be 2 records (one to hold Days and one to Hold Nights). You do that you can use the SUM function.
Would the table that I make this field (PartOfDay - Days, Nights) be created within the stop tracker table, or would it belong in a table by itself?
Or do you mean that within stop tracker you would have
Line l Date l Reason l Day/Night l #ofStops
Also, you are missing a table. You need a table to sort out your Upstream/Downstream values. It seems its keyed off the Reason field, so you need to set up which Reasons go to Upstream/Downstream in a table.
Once you do those 2 things, this query becomes pretty simple.
I am sorting by the end part of reason name (ie. "*_filler" , "*_caser" ---become upstream) and ("*_sealer", "*_boxing" --- become downstream).
Should I add another field in the stop reason table ( Reasons Constant) where I classify as Upstream or downstream, or should I still use a filter on criteria for this new table?
I mean this:
----
You should store discrete pieces of data discretely. If all those suffix mean something, they should be in their own field. You wouldn't keep demographic data like this:
demographics
German Female
American Male
Chinese Female
French Female
American Female
You would break that data into 2 fields, one to store origin country and one to store gender. Then if you wanted to lump all Euorpeans together you would have a seperate table that lets you know that 'French' maps to Europe, 'German' maps to 'Europe', Chinese maps to Asia, etc.
So the answer is both. You should seperate out that one field (*__ filler) into 2 fields. And you should have another table to tell you how each value maps to Upstream/Downstream.
Or do you mean that within stop tracker you would have
Line l Date l Reason l Day/Night l #ofStops
----
I am sorting by the end part of reason name (ie. "*_filler" , "*_caser" ---become upstream) and ("*_sealer", "*_boxing" --- become downstream).
You should store discrete pieces of data discretely. If all those suffix mean something, they should be in their own field. You wouldn't keep demographic data like this:
demographics
German Female
American Male
Chinese Female
French Female
American Female
You would break that data into 2 fields, one to store origin country and one to store gender. Then if you wanted to lump all Euorpeans together you would have a seperate table that lets you know that 'French' maps to Europe, 'German' maps to 'Europe', Chinese maps to Asia, etc.
So the answer is both. You should seperate out that one field (*__ filler) into 2 fields. And you should have another table to tell you how each value maps to Upstream/Downstream.
fortwrestler
Registered User.
- Local time
- Today, 04:52
- Joined
- Jan 15, 2016
- Messages
- 50
Gotcha,
So I've accomplished part 1.
I'm kinda confused on part two....
So right now, my Reason is "Peroxide Issue_Filler" . Are you saying I should have
Reason - "Peroxide Issue" , Equipment - "Filler" ?
Then on my table say IF equipment = "Filler", etc then Upstream and IF equipment = "some downstream equipment" then downstream?
By that I mean Field 1 = Upstream, Field 2 = Downstream
fortwrestler
Registered User.
- Local time
- Today, 04:52
- Joined
- Jan 15, 2016
- Messages
- 50
Got it...So i'm all caught up and good to go it appears.
Now back to the original question...
I can get the cross tab to display like I want, and generate a report from there....but I would have to create a report every time the week would change.
Is there a way to generate a cross tab report by week without creating a new report? Or would I have to generate a new report each week?
IE. can I make the entry dates on the report a variable value versus a fixed value
Original question? I thought we were 2 removed from there trying to fix another query that fed it.
Yes you can probably create one and have it determine what's the proper timeframe of data to show. Specifically though, I'm lost and can't help you. We've travelled too far.
Is there a way to generate a cross tab report by week without creating a new report?
Yes you can probably create one and have it determine what's the proper timeframe of data to show. Specifically though, I'm lost and can't help you. We've travelled too far.
Similar threads
- Replies
- 10
- Views
- 506
- Replies
- 1
- Views
- 679
- Replies
- 11
- Views
- 1,056
- Replies
- 18
- Views
- 775
Users who are viewing this thread
Total: 1 (members: 0, guests: 1)