Solved Crosstab Query Date Help (1 Viewer)

KINGOFCHAOS17

Member
Local time
Today, 17:13
Joined
Mar 20, 2020
Messages
31
I have a crosstab query which is currently grouping the data by year (see attached screenshot). It pulls data based on a DLookUp in another table (screen shot attached). The dates in the table will always be input as a complete 12 month range. This range can start anytime in the year and will cross calendar years. For this example how would I group the data from March 2017 to February 2018, March 2018 to February 2019, and finally March 2019 to February 2020. I need the solution to be dynamic based on the dates entered in the
 

Attachments

  • Crosstab Query.jpg
    Crosstab Query.jpg
    137.9 KB · Views: 223
  • Date Table.jpg
    Date Table.jpg
    14.1 KB · Views: 462

strive4peace

AWF VIP
Local time
Today, 12:13
Joined
Apr 3, 2020
Messages
1,003
hi King of Chaos,

Welcome!

instead of dLookup, you can add the TAQDate table to the top with no relationships

Assuming dates have no times, try this:

field --> ATDate
Total --> Where
criteria --> between [TAQStart] and [TAQend]

field --> Range: "r" & Format( [TAQStart],"yymm") & "_" & Format( [TAQend],"yymm")
Total --> Group By
Crosstab --> Column Heading

I prefaced the column heading field with "r" so it doesn't start with a number (that can create problems)

You would have 3 records in TAQDate for the 3 years you want
 

KINGOFCHAOS17

Member
Local time
Today, 17:13
Joined
Mar 20, 2020
Messages
31
Thank you, unfortunately it didn't like that, received an error (attached). Had this problem in the past and a user on here recommended the DLookUp. Any other suggestions?
 

strive4peace

AWF VIP
Local time
Today, 12:13
Joined
Apr 3, 2020
Messages
1,003
hi King of Chaos,

aah, make a query with the first two tables
then make a second query using that query and add the TAQDate table with no relationship
 
Last edited:

KINGOFCHAOS17

Member
Local time
Today, 17:13
Joined
Mar 20, 2020
Messages
31
Thanks for your help. I've done as you've suggested but think I've made a mistake somewhere as it's not giving the expected results. I've attached a screenshot of the two queries and that of the outcome. Can you advise where I've gone wrong? Access isn't my strong point and very much struggle when writing queries.
 

Attachments

  • Query 1.jpg
    Query 1.jpg
    78.2 KB · Views: 381
  • Query 2.jpg
    Query 2.jpg
    79.7 KB · Views: 444
  • Query 2 Outcome.jpg
    Query 2 Outcome.jpg
    29.6 KB · Views: 220

strive4peace

AWF VIP
Local time
Today, 12:13
Joined
Apr 3, 2020
Messages
1,003
hi King of Chaos,

you're welcome :)

don't put criteria in the first query with the 2 tables. Criteria would go in the second query

repeating from above:

field --> ATDate
Total --> Where
criteria --> between [TAQStart] and [TAQend]

field --> Range: "r" & Format( [TAQStart],"yymm") & "_" & Format( [TAQend],"yymm")
Total --> Group By
Crosstab --> Column Heading
 

KINGOFCHAOS17

Member
Local time
Today, 17:13
Joined
Mar 20, 2020
Messages
31
Thanks for your follow up.

So, I amended the first criteria as you suggested and received the same outcome. See attached screenshots. Any suggestions?
 

Attachments

  • Query 1.jpg
    Query 1.jpg
    54.8 KB · Views: 446
  • Query 2 Outcome.jpg
    Query 2 Outcome.jpg
    41.8 KB · Views: 442
  • Query 2.jpg
    Query 2.jpg
    89.1 KB · Views: 245

strive4peace

AWF VIP
Local time
Today, 12:13
Joined
Apr 3, 2020
Messages
1,003
hi King of Chaos,

would you please upload a sample database? Tell us the name of your two queries and what results you expect
thank you!
 

KINGOFCHAOS17

Member
Local time
Today, 17:13
Joined
Mar 20, 2020
Messages
31
Unfortunately the database resides on a server that's accessed via Remote Desktop which has the ability to export data between environments disabled. The best I can provide is screen shots as I've been doing.

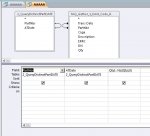
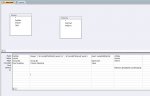
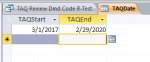
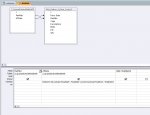
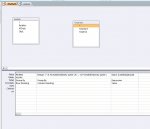
So the crosstab query I've constructed currently groups by the year and pulls the data based on a DLookUp from another table. The data is always in 12 month periods and can cross calendar years. What I would like is for the crosstab to group based on each 12 month period (i.e. March 2017 to February 2018, March 2018 to February 2019, and finally March 2019 to February 2020) assuming per the date table screenshot the dates run from 1st March 2017 to 29th February 2020. Column titles aren't overly important by something along the lines of Year1, Year2 and Year3 would be preferred.

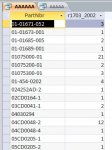
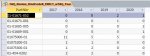
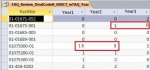
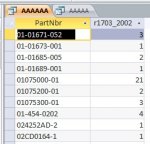
I've attached an example of what I'd like to achieve (quickly constructed in paint). So in this example the 1 against 01-01673-001 though having a date in 2019 occurred in in the second group of 12 months (March 2018 to February 2019) and therefore is accounted against column Year2.

I've also shown examples where quantity 2 against 01075000-01 have moved from Year2 to Year1 because the dates occurred in the first group of 12 months (March 2017 to February 2018).

Hope that makes sense and thank you for your continued help.
 

Attachments

  • Crosstab Query Results.jpg
    Crosstab Query Results.jpg
    40.4 KB · Views: 433
  • Date Table.jpg
    Date Table.jpg
    14.1 KB · Views: 449
  • Crosstab Query what I'd like to see.jpg
    Crosstab Query what I'd like to see.jpg
    35.2 KB · Views: 431

Users who are viewing this thread

Top Bottom