Export query from ms access to excel and create chart (1 Viewer)

gippsy

Registered User.
Local time
Today, 03:45
Joined
Dec 15, 2012
Messages
39
Hello
I am trying to run a code to access-query-to-excel-2010-to-create-a-graph-via-vba. However, anytime the editor displays ERROR 91.:confused:
I cannot see the final product.
Moreover, I need the query and the chart in the same worksheet and save the file.
'Any help is welcome.

This is the code:
Code:
Option Compare Database
Option Explicit

Sub cmdTransfer_Click()
Dim sExcelWB As Workbook

Dim xl As Object ''Excel.Application
Dim wb As Object ''Excel.Workbook
Dim ws As Object ''Excel.Worksheet
Dim ch As Object ''Excel.Chart
Dim myRange As Object

Set xl = CreateObject("Excel.Application")

sExcelWB = "D:\testing\testchart.xlsx"

'This will overwrite any previous run of this query to this workbook

DoCmd.TransferSpreadsheet acExport, acSpreadsheetTypeExcel9, "qry_01", sExcelWB, True

Set wb = xl.Workbooks.Open(sExcelWB)

'Sheets are named with the Access query name
Set ws = wb.Sheets("qry_01")
Set ch = xl.Charts.Add
ch.ChartType = xlColumnClustered


xl.Visible = True
xl.UserControl = True

End Sub
 

Ranman256

Well-known member
Local time
Today, 04:45
Joined
Apr 9, 2015
Messages
4,337
instead off adding the chart,
can you make a chart of existing data,
then when you export the next dataset, adjust the existing chart to the new data range?

you didnt say where in the code the error happens.
err 91 is object not created, usu because the excel variable did not create.
try:
Code:
Set xl = CreateObject("excel.application")
With xl
    .Workbooks.Open pvFile
 

gippsy

Registered User.
Local time
Today, 03:45
Joined
Dec 15, 2012
Messages
39
Many thanks for your reply.
I apologize. The Editor displays the ERROR 91 on the line:
sExcelWB = "D:\testing\testchart.xlsx"

On the other hand, when I add your code the editor displays this message:
"Compilation Error variable not defined"
I don't know what is pvfile and the type of variable.

This is my first step in my access exercises. I am designing a form to search by two range of dates and a code value.
 

JHB

Have been here a while
Local time
Today, 09:45
Joined
Jun 17, 2012
Messages
7,732
sExcelWB is defined as a Workbook object, actually it should be a string variable, so change it to:
Code:
Dim sExcelWB As String
 

gippsy

Registered User.
Local time
Today, 03:45
Joined
Dec 15, 2012
Messages
39
Hello.
The code works nice and now I see the chart in Sheet Chart and the query in Sheet qry_01.
How can I do to display the Chart and the Query in the same sheet with the query name?
I really appreciate your help.
 

Attachments

  • qryandchart.jpg
    qryandchart.jpg
    61.7 KB · Views: 518

gippsy

Registered User.
Local time
Today, 03:45
Joined
Dec 15, 2012
Messages
39
JHB
The problem was ERROR 91. Now the Error is fixed
The use of With is unnecessary
'With xl
'.Workbooks.Open sExcelWB
'End With

Thanks, again
 

gippsy

Registered User.
Local time
Today, 03:45
Joined
Dec 15, 2012
Messages
39
Thanks to JHV, this line of code use all range of data from the query to insert the graph.
Code:
DoCmd.TransferSpreadsheet acExport, acSpreadsheetTypeExcel9, "qry_task", sExcelWB, True
Set wb = xl.Workbooks.Open(sExcelWB)
Set ws = wb.Sheets("qry_task")
Set ch = xl.Charts.Add
ch.ChartType = xlColumnClustered

For my Chart, I need the range("C2:D
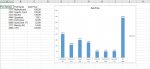
" i-1). However, I don't know write such line of code into MS Access.:confused:

In addition, I need to insert a secondary axis. The code below works fine in Excel but not in MS Access.

Code:
.ActiveSheet.ChartObjects("Chart 1").Activate
.ActiveChart.PlotArea.Select
.ActiveChart.FullSeriesCollection(2).Select
.ActiveChart.FullSeriesCollection(2).AxisGroup = 2
.ActiveChart.FullSeriesCollection(2).Select
.ActiveChart.FullSeriesCollection(2).ChartType = xlLineMarkers
.ActiveChart.FullSeriesCollection(1).Select
.ActiveChart.ChartGroups(1).GapWidth = 69
.ActiveChart.FullSeriesCollection(2).Select
.Application.CommandBars("Format Object").Visible = False
.ActiveSheet.Shapes("Chart 1").ScaleWidth 1.5180265655, msoFalse, _
    msoScaleFromTopLeft

How can I use this code in MS Access?:banghead:
I really appreciate your help
 

June7

AWF VIP
Local time
Today, 00:45
Joined
Mar 9, 2014
Messages
5,423
Why export to Excel? I am able to replicate this chart in Access2010.

Adds chart to the declared worksheet:

Set ch = ws.Shapes.AddChart.Chart

The following works for me:
Code:
Set ws = wb.Sheets("Table1")
Set ch = ws.Shapes.AddChart.Chart
With ch
    .ChartType = xlColumnClustered
    .SeriesCollection(2).AxisGroup = 2
    .SeriesCollection(2).ChartType = xlLineMarkers
    .ChartGroups(1).GapWidth = 69
End With
ws.Shapes("Chart 1").ScaleWidth 1.5180265655, msoFalse, msoScaleFromTopLeft
The following line does not work:
Application.CommandBars("Format Object").Visible = False
 
Last edited:

Cronk

Registered User.
Local time
Today, 19:45
Joined
Jul 4, 2013
Messages
2,770
@gippsy


Code like
Code:
.ActiveSheet.PlotArea............
works in the Excel environment. However, from Access you need to use the reference to the Excel object. ie use
Code:
xl.ActiveSheet.Plotarea.....
or

Code:
with xl
   .ActiveSheet.PlotArea....
   .....
end with
 

gippsy

Registered User.
Local time
Today, 03:45
Joined
Dec 15, 2012
Messages
39
June 7.
Your code with my query works fine. Many thanks.
In my database, I have a command button to export a query to Excel Worksheet and create a chart.

Nevertheless, I need the chart data from query Range("C2:D" i-1).
I have this code from excel:

Code:
.SetSourceData Source:=xlSheet.Range("C2:D" & i - 1)

Could you give an idea of how to write the above code range in MS Access?
 

gippsy

Registered User.
Local time
Today, 03:45
Joined
Dec 15, 2012
Messages
39
Cronk. Many thanks
I'll keep your code lines. I see these are another ways to create a chart.

Now, I'm focused on writing Range("C2:D" & i - 1) from the query to create the graph.
I really appreciate your help.
 

gippsy

Registered User.
Local time
Today, 03:45
Joined
Dec 15, 2012
Messages
39
June7. Many thanks.
I just tested this code and works fine:
Code:
Set ws = wb.Sheets("qry_task")
Range("C2").Select
    Range(Selection, Selection.End(xlToRight)).Select
    Range(Selection, Selection.End(xlDown)).Select
    ActiveSheet.Shapes.AddChart2(201, xlColumnClustered).Select
    ActiveChart.SetSourceData Source:=Range("qry_task!$C$2:$E$27")

Set ch = ws.Shapes.AddChart.Chart

However, Range will start always in C:2 but, D will be always different. Therefore, I have been trying a code like Range("C2:D" i-1).
Any idea is welcome
 

June7

AWF VIP
Local time
Today, 00:45
Joined
Mar 9, 2014
Messages
5,423
Bing: excel vba get last row number

Read one long discussion on the topic. The first code I tested worked:

i = ws.UsedRange.Row + ws.UsedRange.Rows.Count - 1
 

gippsy

Registered User.
Local time
Today, 03:45
Joined
Dec 15, 2012
Messages
39
June7.
I will test the code. As soon as possible, I will let you know if I succeed.

Also, I have been trying this line of code.
Code:
Range("C2", range("D2").End(xlDown)
However, I don't know what I have to write before Range.

Thanks, again.
 

June7

AWF VIP
Local time
Today, 00:45
Joined
Mar 9, 2014
Messages
5,423
ws.Range("C2", ws.Range("D2").End(xlDown).Select

Will select the range.
 

gippsy

Registered User.
Local time
Today, 03:45
Joined
Dec 15, 2012
Messages
39
June7, Cronk, JHB, Ranman256
For all of you, many thanks.
Finally, I have a code to export and create a chart in excel.
This is my code:
Code:
ub cmdTransfer_Click()
Dim sExcelWB As String
Dim xl As Object ''Excel.Application
Dim wb As Object ''Excel.Workbook
Dim ws As Object ''Excel.Worksheet
Dim ch As Object ''Excel.Chart
Dim myMax As Double
Dim myMin As Double

Set xl = CreateObject("excel.application")
sExcelWB = "D:\testing2\" & qry_01.xls" ''sometimesthe i write "qry_task"
DoCmd.TransferSpreadsheet acExport, acSpreadsheetTypeExcel9, "qry_task", sExcelWB, True
Set wb = xl.Workbooks.Open(sExcelWB)
Set ws = wb.Sheets("qry_task")

Set ch = ws.Shapes.AddChart.Chart
 

Users who are viewing this thread

Top Bottom