Hi,
unfortuately I have a problem with the data source of a graph in an form.
First of all: I am using Access 2013.
I have a cross table like this:
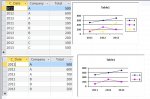
tbl_crosstable:
C_Datum | Company A | Company XY
-----------------------------------
2011 500 100
2012 600 300
2013 700 200
If I creat a diagram (line graph) on this table, everything is fine.
But: The table has not always 2 companies. Sometimes one, sometimes 3 or even more.
Is it possible to get always all data series in the graph?
E.g.: If the cross table has 4 companies -> graph has 4 companies (4 lines). If the cross table has 5 companies -> graph has 5 companies (5 lines) and so on.
The data source of the graph:
Something like
is unfortunately not working.
Maybe there is a VBA possibility so solve this problem?
Thank you very much in advance!
unfortuately I have a problem with the data source of a graph in an form.
First of all: I am using Access 2013.
I have a cross table like this:
tbl_crosstable:
C_Datum | Company A | Company XY
-----------------------------------
2011 500 100
2012 600 300
2013 700 200
If I creat a diagram (line graph) on this table, everything is fine.
But: The table has not always 2 companies. Sometimes one, sometimes 3 or even more.
Is it possible to get always all data series in the graph?
E.g.: If the cross table has 4 companies -> graph has 4 companies (4 lines). If the cross table has 5 companies -> graph has 5 companies (5 lines) and so on.
The data source of the graph:
Code:
SELECT (Format([UIDE_Date],"Short Date")) AS Ausdr1, Sum(tblcrosstable.[Company A]) AS [SumCompany  A], Sum(tblcrosstable.[Company XY]) AS [SumCompany XY]
FROM tblcrosstable
GROUP BY (Format([UIDE_Date],"Short Date")), (Int([UIDE_Date]));
Something like
Code:
SELECT tblcrosstable.*Maybe there is a VBA possibility so solve this problem?
Thank you very much in advance!
")