You are using an out of date browser. It may not display this or other websites correctly.
You should upgrade or use an alternative browser.
You should upgrade or use an alternative browser.
how i can do this???
- Thread starter goheriq
- Start date
OK, to help you resolve your problem, we need to first 'un-excel spreadsheet" your access tables. Please provide the following:
- a screenshot of your relationship view (which includes all your tables)
- or, even better - upload your database as it is now.
then we can work on making sure you have your database structured in a way that will allow you to do what you want it to do.
- a description of what you want the database in general to do (e.g., i work for a small pawn broker and we want to keep track the balance from our lendees... etc etc)
- what your spreadsheet currently does and how it works (does it have more than one sheet? does it have graphs? does it link to other excel files? etc) - perhaps some sample data or upload a (sanitized) version of it (that is, don't include personal/private info)
- a description of the environment your spreadsheet is currently working (e.g., is it located on a work server, do multiple people have/need access to it? do you import data into it from somewhere else, or is it all manually updated? etc)
- why you want to port your excel process into access: that is, what do you want to be able to do that your excel sheet cannot (you said the excel works perfectly, so why upgrade?)
once we have your structure sorted out, then we can work on getting the functionality set up.
as i said that i am stater at access, therefore i did not have multi table relations,
i tried to update my database but it is not happened because of forum limitations, as my file size is 4.75 mb
what can i do?
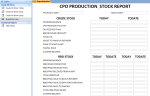
i have uploaded my file, i want to update my production data daily basis please review how i can manage it properly.........
Attachments
Last edited:
wiklendt
i recommend chocolate
- Local time
- Today, 20:51
- Joined
- Mar 10, 2008
- Messages
- 1,746
hi wiklendt,
are you have study my case?
is there any progress...?
I have just returned from a few days away.
I have opened your database file but without all the other information i asked about i remain confused as to how your data fits together. i have no idea about stocks or what you are trying to calculate (yes, i see your pictures, but they do not help me understand your problem).
Please answer the questions in my previous post.
Also, you said you have an excel spreadsheet where everything you want works perfectly - could you attach your excel file and i might be able to get a better understanding of what data you have and what you want to get out of the data. i can also interrogate your excel formulas to get a better understanding of how you want to manipulate the data.
- a description of what you want the database in general to do (e.g., i work for a small pawn broker and we want to keep track the balance from our lendees... etc etc)
- what your spreadsheet currently does and how it works (does it have more than one sheet? does it have graphs? does it link to other excel files? etc) - perhaps some sample data or upload a (sanitized) version of it (that is, don't include personal/private info)
- a description of the environment your spreadsheet is currently working (e.g., is it located on a work server, do multiple people have/need access to it? do you import data into it from somewhere else, or is it all manually updated? etc)
- why you want to port your excel process into access: that is, what do you want to be able to do that your excel sheet cannot (you said the excel works perfectly, so why upgrade?)
Thanks.
dear your answers are..
1:- i am not a broker, i am working in process industry in production department
2:- i am using multiple sheets to generate a production report
3:- currently its on my personal computer therefore no one have access , its my personal file due to which not on any server
4:- excel does it perfectly but for each day, or once in month i have to add multiple sheets, change its references, and add data on individual sheet,
i just want to upgrade to MS ACCESS type the data in a single form, and design the sheet once, to reduce my daily/monthly practice adding sheets, references ....etc
therefore my excel data example sheet is attached here..
please study my case.............
Attachments
wiklendt
i recommend chocolate
- Local time
- Today, 20:51
- Joined
- Mar 10, 2008
- Messages
- 1,746
OK, just to clarify: your "to date" column is a calculation for the current month only, so what you would want would reset on the beginning of each new month, with opening balance of the new month being the closing balance of the previous month. is that right ?
wiklendt
i recommend chocolate
- Local time
- Today, 20:51
- Joined
- Mar 10, 2008
- Messages
- 1,746
OK, how about this.
I thought about your problem and your desire to not have to redo all the report each day and month.
I think excel can still be your main program for this data. I considered your current skills set and think you may appreciate staying in excel if it can do what you have asked. Dates are notoriously difficult to deal with in access, so i thought excel would be better for the task of calculating closing and opening stock values.
Have a look at the excel workbook now. Post back here if you have any questions about how the formulas work or anything you need changed.
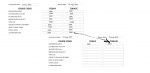
I have created a single "Data" sheet where all your manually entered values are input each in a separate column. This sheet also has all the calculated values in columns but they are hidden. you can unhide them by auto-sizing the columns in the sheet. New days are a new row (you must add new days to the very next available row so formulas are copied for each day).
The data is set into a "Table", which allows new rows to copy any formulas from the rows above. these formulae automatically detect new months for the monthly cumulative data, so the formulae don't need to be changed at all.
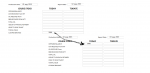
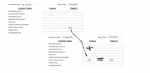
I have also considered that you may want/need the report in the format you had. So i created a new sheet called "Report" and all you need to do is add the date of production in the highlighted yellow section and it will auto-fill with all the data from the "Data" sheet for the correct date. You must make sure to type the date correctly so that access recognizes that you have used a date not another number. I have formatted it in such a way that any value greater than zero will be highlighted in green so that you can easily distinguish those cells with a value and those with three decimal zero value (0.000 vs 5.346 = much easier to read/see if highlighted IMHO). I also added a red highlight in case there are any values less than zero, to prompt you to double check your data entry or to alert you of a negative in your production.
What do you think. I think this is a much simpler solution that gives you what you said you wanted. It is also possible to do things like create graphs to have summaries etc, which is much, much harder in access.
Please note: For the "Data" sheet, any field with calculations i have formatted in grey. You had some discrepancy/change between july and august how two fields were handled (manually updated vs. calculated) so i kept this discrepancy in the new sheet which is why you see only two grey cells. I have not always understood why you have calculated the way you have, but i have made the same calculations for you in the "Data" sheet because i assume you understand your data much better than i do.
Also, i have left your original sheets in tact. i had to format the cells in such a way so that i could see which ones had a formula so i could walk through your data easier. if you want to remove this formatting, go to the conditional formatting menu and remove the formatting there.
I thought about your problem and your desire to not have to redo all the report each day and month.
I think excel can still be your main program for this data. I considered your current skills set and think you may appreciate staying in excel if it can do what you have asked. Dates are notoriously difficult to deal with in access, so i thought excel would be better for the task of calculating closing and opening stock values.
Have a look at the excel workbook now. Post back here if you have any questions about how the formulas work or anything you need changed.
I have created a single "Data" sheet where all your manually entered values are input each in a separate column. This sheet also has all the calculated values in columns but they are hidden. you can unhide them by auto-sizing the columns in the sheet. New days are a new row (you must add new days to the very next available row so formulas are copied for each day).
The data is set into a "Table", which allows new rows to copy any formulas from the rows above. these formulae automatically detect new months for the monthly cumulative data, so the formulae don't need to be changed at all.
I have also considered that you may want/need the report in the format you had. So i created a new sheet called "Report" and all you need to do is add the date of production in the highlighted yellow section and it will auto-fill with all the data from the "Data" sheet for the correct date. You must make sure to type the date correctly so that access recognizes that you have used a date not another number. I have formatted it in such a way that any value greater than zero will be highlighted in green so that you can easily distinguish those cells with a value and those with three decimal zero value (0.000 vs 5.346 = much easier to read/see if highlighted IMHO). I also added a red highlight in case there are any values less than zero, to prompt you to double check your data entry or to alert you of a negative in your production.
What do you think. I think this is a much simpler solution that gives you what you said you wanted. It is also possible to do things like create graphs to have summaries etc, which is much, much harder in access.
Please note: For the "Data" sheet, any field with calculations i have formatted in grey. You had some discrepancy/change between july and august how two fields were handled (manually updated vs. calculated) so i kept this discrepancy in the new sheet which is why you see only two grey cells. I have not always understood why you have calculated the way you have, but i have made the same calculations for you in the "Data" sheet because i assume you understand your data much better than i do.
Also, i have left your original sheets in tact. i had to format the cells in such a way so that i could see which ones had a formula so i could walk through your data easier. if you want to remove this formatting, go to the conditional formatting menu and remove the formatting there.
Attachments
thanks wiklendt
i replied little bit late because i was analyzing the sheet that you have created by entering my data, how it will be beneficial to me..
and i found it great and so much helpful to me.
thanks again
if any help required i will contact to you
can you give me your direct contact
i replied little bit late because i was analyzing the sheet that you have created by entering my data, how it will be beneficial to me..
and i found it great and so much helpful to me.
thanks again
if any help required i will contact to you
can you give me your direct contact
wiklendt
i recommend chocolate
- Local time
- Today, 20:51
- Joined
- Mar 10, 2008
- Messages
- 1,746
I am glad it is suitable for you.
Unfortunately it is against my personal policy to give out my personal contact details. I much prefer, when you have a problem, to post it on this site (it also has an excel forum). That way, more people with similar problems can also follow a solution and if I'm not available (which often can happen) then there is a large population here to help you instead.
Good luck in your future projects. Report back to the forums if u need more help.
wiklendt
i recommend chocolate
- Local time
- Today, 20:51
- Joined
- Mar 10, 2008
- Messages
- 1,746
hi wiklendt, hope you will fine..
i have a question about last conversation
how i can protect Report sheet except prod. date cell
A quick google search would have provided the same information, sometimes with screenshots.
The workbook i uploaded already has this setup for you. Test this by trying to type over one of the cells in the sheet.
If you are asking actually how i did this:
1) right click on the cell you want to be able to update even when the sheet is protected.
2) click on "format cells...."
3) go to the "Protection" tab (it should be the last one)
4) uncheck the "Locked" box.
5) click ok
6) go to the "Review" ribbon menu
7) click on "Protect sheet"
8) leave all default settings
9) click ok.
if you are asking how to remove protection so that you can make changes:
1) go to the "Review" ribbon menu
1) click on "Unprotect sheet"
Similar threads
- Replies
- 9
- Views
- 479
- Replies
- 9
- Views
- 966
Users who are viewing this thread
Total: 1 (members: 0, guests: 1)