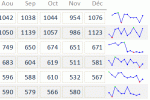
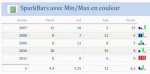
Because a graphic is more explicit than numbers...
Module Source code:
Best regards,
Philippe
Module Source code:
Code:
Option Explicit
'------------------------------------------------------------------------------------------------------------------
'Object : How to add sparklines on an Access report
' -> SparkLine, SparkBars, SparkOnOff
'Date : 29/01/2011
'Author : Philben (based on an idea of E. Tufte - en.wikipedia.org/wiki/Sparkline)
'Version: 1.0
'Call : On the SectionName_Format event in the report
'-------------------------------------------------------------------------------------------------------------------
'Constants for the SparkLine function
Private Const clLineColor As Long = vbBlue    'Line color
Private Const clMinPointColor As Long = vbRed    'Min point color
Private Const clMaxPointColor As Long = vbGreen    'Max point color
Private Const clPointRadius As Long = 15    'Radius of the point (in twips)
'Constants for SparkBars
Private Const clBarColor As Long = vbBlue    'Bar color
Private Const clMinBarColor As Long = vbRed    'Min color
Private Const clMaxBarColor As Long = vbGreen    'Max color
'Constants for SparkOnOff
Private Const clOnBarColor As Long = vbBlue    'Color of positives bars
Private Const clOffBarColor As Long = vbRed    'Color of negatives bars
Private Const clPivotBarColor As Long = vbBlack    'Color of the pivot value
Private Const clPivotHeight As Long = 10    'Height of the pivot (in twips)
'To draw a line graph
'Parameters :
' - Reference of the label control to define the position and the dimensions of the sparkbars
' - The list of values
Public Sub SparkLine(ByRef oSL As Access.Label, ParamArray aValues() As Variant)
    Const clNone As Long = -1
    Dim oRpt As Access.Report
    Dim vMin As Variant, vMax As Variant
    Dim i As Long, lUpper As Long, X As Long, Y As Long, lTmpY As Long, lLastY As Long
    Dim lSpaceWidth As Long, lCountSpace As Long
    Dim fCst As Single
    lUpper = UBound(aValues)
    For i = 0 To lUpper
        If Not IsNull(aValues(i)) Then
            If Not IsEmpty(vMax) Then
                If aValues(i) > vMax Then vMax = aValues(i)
            Else
                vMax = aValues(i)
            End If
            If Not IsEmpty(vMin) Then
                If aValues(i) < vMin Then vMin = aValues(i)
            Else
                vMin = aValues(i)
            End If
        End If
    Next i
    If Not IsEmpty(vMin) Then
        With oSL
            lSpaceWidth = (.Width - 2 * clPointRadius) / lUpper
            X = .Left + clPointRadius
            fCst = CSng((.Height - 2 * clPointRadius))
            If vMax <> vMin Then
                fCst = CSng(fCst / (vMax - vMin))
            End If
            Y = .Top + .Height
        End With
        Set oRpt = oSL.Parent
        If IsNull(aValues(0)) Then
            lLastY = clNone
        Else
            lLastY = CLng(Y - (aValues(0) - vMin) * fCst - clPointRadius)
        End If
        lCountSpace = 1
        For i = 1 To lUpper
            If Not IsNull(aValues(i)) Then
                lTmpY = CLng(Y - (aValues(i) - vMin) * fCst - clPointRadius)
                If lLastY <> clNone Then
                    oRpt.Line (X, lLastY)-(X + lSpaceWidth * lCountSpace, lTmpY), clLineColor
                    SparkLinePoint oRpt, X, lLastY, aValues(i - lCountSpace), vMin, vMax
                End If
                X = X + lSpaceWidth * lCountSpace
                lLastY = lTmpY
                lCountSpace = 1
            Else
                lCountSpace = lCountSpace + 1
            End If
        Next i
        If lLastY <> clNone Then SparkLinePoint oRpt, X, lLastY, aValues(i - lCountSpace), vMin, vMax
    End If
End Sub
'To draw a bars graph
'Parameters :
' - Reference of the label control to define the position and the dimensions of the sparkbars
' - The list of values
Public Sub SparkBars(ByRef oSL As Access.Label, ParamArray aValues() As Variant)
    Dim vMin As Variant, vMax As Variant, vMinR As Variant
    Dim i As Long, lUpper As Long, X As Long, Y As Long, Yr As Long
    Dim lBarWidth As Long, lSpaceWidth As Long, lColor As Long
    Dim fCst As Single
    lUpper = UBound(aValues)
    For i = 0 To lUpper
        If Not IsNull(aValues(i)) Then
            If Not IsEmpty(vMax) Then
                If aValues(i) > vMax Then vMax = aValues(i)
            Else
                vMax = aValues(i)
            End If
            If Not IsEmpty(vMin) Then
                If aValues(i) < vMin Then vMin = aValues(i)
            Else
                vMin = aValues(i)
            End If
        End If
    Next i
    If Not IsEmpty(vMin) Then
        Select Case vMin
        Case Is < vMax
            vMinR = vMin - ((vMax - vMin) / 10)
        Case Is <> 0
            vMinR = vMin - Sgn(vMin) * vMin / 10
        Case Else
            vMinR = 0.9
        End Select
        With oSL
            lBarWidth = CLng(.Width / (lUpper * 1.5 + 1))
            lSpaceWidth = CLng(lBarWidth / 2)
            X = .Left
            Yr = .Height
            Y = .Top + Yr
        End With
        fCst = CSng(Yr / (vMax - vMinR))
        For i = 0 To lUpper
            If Not IsNull(aValues(i)) Then
                Select Case aValues(i)
                Case Is >= vMax
                    lColor = clMaxBarColor
                Case Is <= vMin
                    lColor = clMinBarColor
                Case Else
                    lColor = clBarColor
                End Select
                oSL.Parent.Line (X, Y)-(X + lBarWidth, CLng(Y - (aValues(i) - vMinR) * fCst)), lColor, BF
            End If
            X = X + lBarWidth + lSpaceWidth
        Next i
    End If
End Sub
'To Draw a On/Off graph
'Parameters :
' - Reference of the label to define the position and the dimensions of the sparkbars
' - the pivot value
' - The list of values
Public Sub SparkOnOff(ByRef oSL As Access.Label, ByVal vPivot As Variant, ParamArray aValues() As Variant)
    Dim i As Long, lUpper As Long, X As Long, Y1 As Long, Y2 As Long, lPivotTop As Long
    Dim lBarHeight As Long, lBarWidth As Long, lSpaceWidth As Long, lColor As Long
    vPivot = Nz(vPivot, 0)
    lUpper = UBound(aValues)
    With oSL
        lBarWidth = CLng(.Width / (lUpper * 1.5 + 1))
        lSpaceWidth = CLng(lBarWidth / 2)
        lBarHeight = CLng(.Height - clPivotHeight) / 2
        lPivotTop = .Top + lBarHeight + 1
        X = .Left
    End With
    For i = 0 To lUpper
        If Not IsNull(aValues(i)) Then
            Select Case aValues(i)
            Case Is > vPivot
                Y1 = lPivotTop - 1
                Y2 = Y1 - lBarHeight
                lColor = clOnBarColor
            Case Is < vPivot
                Y1 = lPivotTop + clPivotHeight + 1
                Y2 = Y1 + lBarHeight
                lColor = clOffBarColor
            Case Else
                Y1 = lPivotTop
                Y2 = Y1 + clPivotHeight
                lColor = clPivotBarColor
            End Select
            oSL.Parent.Line (X, Y1)-(X + lBarWidth, Y2), lColor, BF
        End If
        X = X + lBarWidth + lSpaceWidth
    Next i
End Sub
'To Draw a circle for each point on the sparkline
'Used by the SparkLine function
Private Sub SparkLinePoint(ByRef oRpt As Access.Report, ByVal X As Long, ByVal Y As Long, ByVal vValue As Variant, _
                           ByVal vMin As Variant, ByVal vMax As Variant)
    Dim lPointColor As Long
    Select Case vValue
    Case Is >= vMax
        lPointColor = clMaxPointColor
    Case Is <= vMin
        lPointColor = clMinPointColor
    Case Else
        lPointColor = clLineColor
    End Select
    oRpt.FillStyle = 0
    oRpt.FillColor = lPointColor
    oRpt.Circle (X, Y), clPointRadius, lPointColor
End Sub
Best regards,
Philippe
Attachments
Last edited by a moderator: