I figured out how to send data to a chart object datasheet. By default the chart is based on A2, B2, C2 & D2 and then three rows of each.
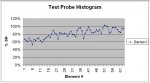
I have 64 data elements that I want to plot in to a histogram (see attached histogram from excell). I have a loop program A1 (or A2) through A64 data. Now how do I get the X-AXIS of the histogram chart assigned to that column of data?
I have 64 data elements that I want to plot in to a histogram (see attached histogram from excell). I have a loop program A1 (or A2) through A64 data. Now how do I get the X-AXIS of the histogram chart assigned to that column of data?