isladogs
MVP / VIP
- Local time
- Today, 04:28
- Joined
- Jan 14, 2017
- Messages
- 18,996
When faced with normalising spreadsheet data for use in Access, various solutions are available often involving complex user defined functions.
By contrast, a very simple approach was recently brought to my attention by long time AWF member alansidman in post #9 of this thread at another forum Converting horizontal Excel data with monthly periods into vertical Access database records
The solution involves the use of Excel Power Query which is built into Excel 2013 and later and available as an add-in for Excel 2010.
In the latest versions of Excel the feature has been renamed as Get & Transform but the functionality is broadly the same.
Power Query is an immensely powerful tool which really should be included with Access. Despite significant online pressure in the Access User Forum, MS have so far ignored many requests over several years to add it to Access.
I am definitely no expert in its use & have barely scratched the surface of what it can do. In fact, I had to ask help from alansidman to understand how it can be used for this purpose.
On the basis that others may also be unaware of its use, here is a brief explanation with 3 Excel files as examples.
Each file contains 2 worksheets and a query
• Sheet1 – original data in crosstab type format
• Sheet2 – ‘normalised’ data suitable for importing to Access
• Query1 – converts Sheet1 to Sheet2
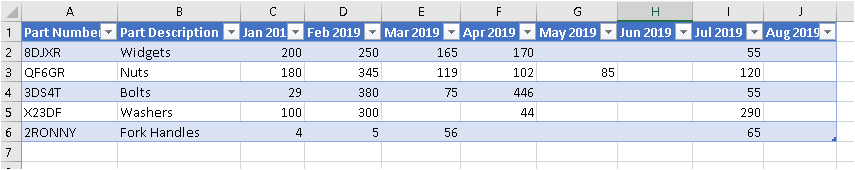
In the simplest of these, (NormaliseDataExample.xlsx), the original data in Sheet1 is
The query used to convert the data is
Table1 is the name given to the range A1: J6 containing data for conversion
PartNumber & PartDescription are the fields that we want to remain unchanged
The monthly data is then converted into 2 columns which will be named MonthYear and Quantity
The conversion is very fast – a fraction of a second.
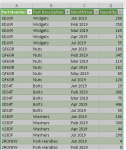
Below is part of the converted data in Sheet2

To convert this yourself, open PowerQuery by clicking the Data tab.
Next click Get Data …From Other Sources…Blank Query.
Click Advanced Editor and enter the above query code in the query window.
Click Done and the converted data is displayed.
Click Close and Load to save this as a new worksheet
The other two examples are slightly more complicated but the idea is basically the same
• StudentAttendanceMarks.xlsx
• CurrencyExchangeData.xlsx
NOTE that each of these were taken from Access crosstab queries each based on 2 tables. As a result, the power query output is only partly normalised and needs to be split further into 2 tables.
I hope this method is useful to others
By contrast, a very simple approach was recently brought to my attention by long time AWF member alansidman in post #9 of this thread at another forum Converting horizontal Excel data with monthly periods into vertical Access database records
The solution involves the use of Excel Power Query which is built into Excel 2013 and later and available as an add-in for Excel 2010.
In the latest versions of Excel the feature has been renamed as Get & Transform but the functionality is broadly the same.
Power Query is an immensely powerful tool which really should be included with Access. Despite significant online pressure in the Access User Forum, MS have so far ignored many requests over several years to add it to Access.
I am definitely no expert in its use & have barely scratched the surface of what it can do. In fact, I had to ask help from alansidman to understand how it can be used for this purpose.
On the basis that others may also be unaware of its use, here is a brief explanation with 3 Excel files as examples.
Each file contains 2 worksheets and a query
• Sheet1 – original data in crosstab type format
• Sheet2 – ‘normalised’ data suitable for importing to Access
• Query1 – converts Sheet1 to Sheet2
In the simplest of these, (NormaliseDataExample.xlsx), the original data in Sheet1 is
The query used to convert the data is
PHP:
let
    Source = Excel.CurrentWorkbook(){[Name="Table1"]}[Content],
    #"Unpivoted Other Columns" = Table.UnpivotOtherColumns(Source, {"Part Number", "Part Description"}, "MonthYear", "Quantity")
in
#"Unpivoted Other Columns"PartNumber & PartDescription are the fields that we want to remain unchanged
The monthly data is then converted into 2 columns which will be named MonthYear and Quantity
The conversion is very fast – a fraction of a second.
Below is part of the converted data in Sheet2
To convert this yourself, open PowerQuery by clicking the Data tab.
Next click Get Data …From Other Sources…Blank Query.
Click Advanced Editor and enter the above query code in the query window.
Click Done and the converted data is displayed.
Click Close and Load to save this as a new worksheet
The other two examples are slightly more complicated but the idea is basically the same
• StudentAttendanceMarks.xlsx
• CurrencyExchangeData.xlsx
NOTE that each of these were taken from Access crosstab queries each based on 2 tables. As a result, the power query output is only partly normalised and needs to be split further into 2 tables.
I hope this method is useful to others
Attachments
Last edited: