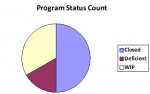
I have a query called "Program Status Count" that keeps track of the current status of various programs. There are three statuses: Closed, Deficient, and WIP.
On the Query, I used "Total:" row and have two fields: StatusID field set to "Group By" then in the next column I have the same StatusID Field set to "Count" (it auto-renamed itself to CountofStatusID)...which on the query does what it is supposed to do:
Closed, 2
Deficient, 1
WIP, 1
When I go to the Report Design and try to make a Pie Chart (or any graph) it asks me what query I want to use, so I point it to the Program Status Count Query and select the only two fields I have in the query.
This is the Row Source Code:
SELECT [StatusID],Count([StatusID]) AS [CountOfStatusID] FROM [Program Status Count] GROUP BY [StatusID];
Sometimes, it will show the appropriate fields but then it will disappear in Report View, switching to Print Preview does not fix the issue. Actually, it often deletes the correct information in the chart and use the PK autonumber instead of the words.
Othertimes, the default data shows up and nothing I do changes it. I have even done the copy/paste of the query table in the report (doesn't help when the graph needs to update.
I have researched and read up on similar issues, but cannot seem to find a fix to this problem.
Any help is appreciated.