Problem getting required data using query for calculations to be used later

keen1598

Registered User.
Local time
Today, 10:38
Joined
Nov 7, 2014
Messages
13
Hi All,

I've been trying unsuccessfully for weeks to try and query a usable data set that would later be used for calculated values in a report.

I'm building a Hospital Acquired Infections Database for my facility to record data and process reports automatically. Previously, I built the system in Excel using VBA and userforms, but the size of the file has become too cumbersome, and now takes too long to process my reports.

So here's the issue.

UNIT_DATA TABLE:
UNIT
INF_MONTH
INF_YEAR
PT_DAYS
CVC_DAYS
IUC_DAYS
VENT_DAYS
APV_DAYS

PT_LEVEL TABLE (There are many fields in this table for recording purposes but I will only list the ones I need for reporting purposes):
UNIT
INF_STE_MAJ
SPECIF_SITE
INF_MONTH
INF_YEAR

So the important numbers I can't seem to collect are the total number infections per month from the PT_LEVEL Table for only select SPECIF_SITE infections.

the Tables are joined Left to Right as Follows:
UNIT_DATA.UNIT - PT_LEVEL.UNIT
UNIT_DATA.INF_MONTH - PT_LEVEL.INF_MONTH
UNIT_DATA.INF_YEAR - PT_LEVEL.INF_YEAR

The UNIT_DATA Table is a monthly collection for the 5 metrics (PT_DAYS, CVC_DAYS, IUC_DAYS, VENT_DAYS, APV_DAYS) regardless of whether or not the number for each is zero. Every unit in the database will have a record for each month and year.

The PT_LEVEL Table will only have records if and when a patient develops an infection. This means there is no cumulative monthly data for the PT_LEVEL Table Data based on SPECIF_SITE infection type.

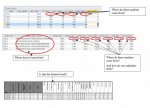
I need to first do a roll up count for every month and year in the database, for which I was initially trying to use the UNIT_DATA table for since it contains every month and year. The problem is when I try to query the SPECIF_SITE from PT_LEVEL, I can get the number of Infections for months where infections where present for each unit and null values, for each month, and each year in UNIT_DATA, but when I include a where condition to narrow the view to only selected SPECIF_SITE's it only shows data for that SPECIF_SITE for months where they occured.

Ideally I need a cummulative monthly aggregation of the totals for a selection of SPECIF_SITE infections, for every unit, for every month, and every year, since July 2010.

Any Suggestions are Welcomed!

Thanks,
 
Could you post some sample data in Excel or MS-Access + a printscreen how you want the result. Zip it because you haven't post 10 post yet.
 
I will do this before the end of today. As some of the data is HIPAA privileged information, I will have to redact some of it.
 
Okay, then I'll wait for it.
 
Hello all (JHB),

Sorry this took me so long. Things, have been a little crazy. Anyway, attached is the redacted version of the tables I would need to use for my calculations in an excel file. Each worksheet is named after the table name from the access db. I also included the datasheet, I used when the excel file was working including the countif formulas so that you might be able to understand a little easier what it is I need to recreate. To save file space, only the first year of data from the EXCELCALCSHT worksheet has actual formulas. The zip file was too large to upload here so I had to copy over them with their respective values.

I also think that I'm going to need an intermediary table if you will to aggregate the transnational data from the PT_LEVEL table into a monthly aggregation. I think what I need to do is have the access db whenever a new distinct month and year is entered for each unit into the UNIT_DATA table, the new aggregating table should create a new record for that month, year, and unit then somehow count the number of occurrences for 'CLABSI' 'CAUTI' 'VAC' 'IVAC' 'POSSIBLE VAC' PROBABLE VAC' in PT_LEVEL.[SPECIF SITE] in separate columns.

I don't know if that's the best way to do it, but I realize after debugging and studying that there is no way to left join UNIT_DATA to PT_LEVEL for just specific variables, because you can't query a value that doesn't exist.

Thanks for the help!
 

Attachments

Thanks for the data, now I need to understand where the various figures come from.

My questions are in the attached file.
 

Attachments

  • Question.jpg
    Question.jpg
    82.8 KB · Views: 396
The data for UNIT_DATA is entered monthly by several individuals, for which I created a form to record everything. NHSN_BM data will be entered by me, because it only needs to be done once annually.

The final image is the data sheet I used to builds reports so yes that would be the desired table I can't seem to recreate.
 
Okay - the problem is you want to combine data stored vertical and horizontally in one go.
It is not possible, so put all data in one direction by using a crosstab query and then base a query on the crosstab query and the two tables "NHSN_BM" and "UNIT_DATA".
Open the attached database and run the query "Alltogether" then you'll get a result shown like in the EXCELCALCSHT worksheet. Except for some columns like GROUP, POSSIBLE VAP etc. where it is not clear where the data is coming from or for time consuming for me to find out how to calculate them. You know how to calculate them, I'm sure you easy can do it yourself.
 

Attachments

This is exactly what I needed. Thank you so much! The crosstab table gave me the foundation I needed to structure my data. Now that I have that I was able to maximize my query. The final result was this:

Code:
SELECT 
V_GROUP_UNIT.GROUP,
UNIT_DATA.UNIT, 
UNIT_DATA.INF_YEAR, 
UNIT_DATA.INF_MONTH, 
CLNG(NZ(PT_SPEC_CROSSTAB.[CLABSI],0)) AS CLABSI, 
CLNG(NZ(PT_SPEC_CROSSTAB.CAUTI, 0)) AS CAUTI, 
CLNG(NZ(PT_SPEC_CROSSTAB.VAC, 0)) AS VAC, 
CLNG(NZ(PT_SPEC_CROSSTAB.IVAC, 0)) AS IVAC,
CLNG(NZ(PT_SPEC_CROSSTAB.[POSSIBLE VAP], 0)) AS POSSIBLE,
CLNG(NZ(PT_SPEC_CROSSTAB.[PROBABLE VAP], 0)) AS PROBABLE,
CLNG(UNIT_DATA.PT_DAYS) AS PT_DAYS, 
CLNG(UNIT_DATA.CVC_DAYS) AS CVC_DAYS, 
CLNG(UNIT_DATA.IUC_DAYS) AS IUC_DAYS, 
CLNG(UNIT_DATA.VENT_DAYS) AS VENT_DAYS, 
CLNG(UNIT_DATA.APV_DAYS) AS APV_DAYS,

IIF(NZ(UNIT_DATA.CVC_DAYS)=0, 0, ROUND(CLABSI/UNIT_DATA.CVC_DAYS *1000,3)) AS CLABSI_RATE,
IIF(NZ(UNIT_DATA.IUC_DAYS)=0, 0, ROUND(CAUTI/UNIT_DATA.IUC_DAYS *1000,3)) AS CAUTI_RATE,
IIF(NZ(UNIT_DATA.VENT_DAYS)=0, 0, ROUND(VAC/UNIT_DATA.VENT_DAYS*1000,3)) AS VAC_RATE,
IIF(NZ(UNIT_DATA.VENT_DAYS)=0, 0, ROUND(IVAC/UNIT_DATA.VENT_DAYS*1000,3)) AS IVAC_RATE,
IIF(NZ(UNIT_DATA.VENT_DAYS)=0, 0, ROUND(POSSIBLE/UNIT_DATA.VENT_DAYS*1000,3)) AS POSSIBLE_VAP_RATE,
IIF(NZ(UNIT_DATA.VENT_DAYS)=0, 0, ROUND(PROBABLE/UNIT_DATA.VENT_DAYS*1000,3)) AS PROBABLE_VAP_RATE,

IIF(NZ(UNIT_DATA.PT_DAYS)=0, 0, ROUND(UNIT_DATA.CVC_DAYS/UNIT_DATA.PT_DAYS,3)) AS CVC_UTIL,
IIF(NZ(UNIT_DATA.PT_DAYS)=0, 0, ROUND(UNIT_DATA.IUC_DAYS/UNIT_DATA.PT_DAYS,3)) AS IUC_UTIL,
IIF(NZ(UNIT_DATA.PT_DAYS)=0, 0, ROUND(UNIT_DATA.VENT_DAYS/UNIT_DATA.PT_DAYS,3)) AS VENT_UTIL,
IIF(NZ(UNIT_DATA.PT_DAYS)=0, 0, ROUND(UNIT_DATA.APV_DAYS/UNIT_DATA.PT_DAYS,3)) AS APV_UTIL,

NHSN_BM.CLABSI_BM, 
NHSN_BM.CLABSI_UR_M, 
NHSN_BM.CAUTI_BM, 
NHSN_BM.CAUTI_UR_M, 
NHSN_BM.VAP_BM, 
NHSN_BM.VAP_UR_M

FROM ((UNIT_DATA 
LEFT JOIN PT_SPEC_CROSSTAB ON 
(UNIT_DATA.UNIT = PT_SPEC_CROSSTAB.UNIT) AND
(UNIT_DATA.INF_YEAR = PT_SPEC_CROSSTAB.INF_YEAR) AND
(UNIT_DATA.INF_MONTH = PT_SPEC_CROSSTAB.INF_MONTH)) 

INNER JOIN NHSN_BM ON 
(UNIT_DATA.UNIT = NHSN_BM.UNIT_LIST) AND 
(UNIT_DATA.INF_YEAR = NHSN_BM.NHSN_BM_YEAR))

LEFT OUTER JOIN V_GROUP_UNIT ON
(UNIT_DATA.UNIT = V_GROUP_UNIT.UNIT)

WHERE (((V_GROUP_UNIT.GROUP)="CCU GROUP"))

ORDER BY 
UNIT_DATA.INF_YEAR, 
UNIT_DATA.INF_MONTH, 
UNIT_DATA.UNIT;

With that being done, I now have another question, is it possible to create a report that is basically just a collection of Pivot Charts from the same data, and arrange it to run with the only interchangeable part being the Group the data is being run for? I have created an individual query for each group so basically, I would like to design 12 charts in the same report format for each group, using various metrics from the above query result, but design it so that it could be called from a report page and produce pdf packets for each group.

Just not sure how to build multiple charts into a report form off the same data?
 
This is exactly what I needed. Thank you so much!
You're welcome.
... I now have another question, is it possible to create a report that is basically just a collection of Pivot Charts from the same data, and arrange it to run with the only interchangeable part being the Group the data is being run for? I have created an individual query for each group so basically, I would like to design 12 charts in the same report format for each group, using various metrics from the above query result, but design it so that it could be called from a report page and produce pdf packets for each group.

Just not sure how to build multiple charts into a report form off the same data?
Why did you create individual query if the only change is the group, why not group them in the report, by a grouping (band)?

By the way did you read my signature? :)
 
Well I still have the main query which is all of the data without a WHERE condition, but I wasn't sure for the purposes of creating reports if that would complicate things more or not, so I did by individual groups as well.

So essentially when I say report, what I mean is a 12 full page charts. All of the data is now in that query data. I would just have to pivot some information around to make each of the charts. Do I have to make 12 individual reports based off that data, one for each chart page, or is there a way to make a 12 page report, where each page is one preformatted chart using the required specified variables, and it would know to run the same data for each group?
 
Is there a way to configure charts to use certain variables and run in the same format as a group report? I don't need a running list of the value so much as visualizations of it in run chart formats. That's where the 12 graphs/charts piece comes in. I run the same charts using the same field and calculations for all of the different groups.
 
Open the attached database open the report "Copy Of EXCELCALCSHT", is it something like that you're looking for?
 

Attachments

Users who are viewing this thread

Back
Top Bottom