Query weekly total and transpose

21Aberdeen

Registered User.
Local time
Today, 09:53
Joined
Sep 29, 2011
Messages
13
Hi

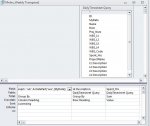
I need help in query of daily activities spent hours
1) to be group as weekly total
2) then need to transpose it for reporting.

My table fields are Date, SpentHrs and Code (activity code description).

Appreciate for your help
Thank you

21Aberdeen
 
I think what you are looking for requires a crosstab query along the following lines - change field and table names as required

Code:
TRANSFORM Sum(SpentHrs) AS SumOfSpentHrs
SELECT DatePart("ww",[MyDate]) AS Expr1
FROM MyTable
GROUP BY DatePart("ww",[MyDate])
PIVOT MyTable.[Code];

Note that Date is a reserved word so recommend you change to another name

...............................
Thank you CJ London,
I appreciate your promtness. This helps me to generate graphs and relevant reports.

21Aberdeen
 
CJ

In cross tab query, can the column heading Pivot DatePart("ww",[MyDate]) currently showing 1, 2, 3 etc. be changed to wk1, wk2, wk3 instead.

Thank you for your advise.
 
yes - just change it to

"wk" & DatePart("ww",[MyDate])
 
Thanks CJ its marvelous.

I've added more records and will continue adding daily until the project is completed. The query shows all new records as I update it.

BUT my subform and report did not picked up the new input whereas the source is from query table.

Did I go wrong somewhere ?

Appreciate to receive further advise.

Thank you
 
BUT my subform and report did not picked up the new input whereas the source is from query table

Is the query table the crosstab query I provided? If so you need to 'fix' the column heading so you need to modify it slightly to:

Code:
TRANSFORM Sum(SpentHrs) AS SumOfSpentHrs
SELECT DatePart("ww",[MyDate]) AS Expr1
FROM MyTable
GROUP BY DatePart("ww",[MyDate])
PIVOT MyTable[COLOR=red] IN (Code1,Code2..etc)[/COLOR]

Where Code1, Code2 etc are the codes you are using so perhaps

(1,2,3)

or

("C1","C2","C3")

depending on whether the codes are numeric or text
 
Thanks CJ

I could not get it to work.... apprecite if you can correct my actual code below (switched view from pivot table, screenshot is attached).

.............................
TRANSFORM Sum([DailyTimesheet Query].Spent_Hrs) AS SumOfSpent_Hrs
SELECT [DailyTimesheet Query].[L4 Description]
FROM [DailyTimesheet Query]
GROUP BY [DailyTimesheet Query].[L4 Description]
ORDER BY "wk" & DatePart("ww",[MyDate])
PIVOT "wk" & DatePart("ww",[MyDate]);
.............................

At the moment this code is perfect.
My concern is currently I've now 5 weeks records and is growing.
 

Attachments

  • SnipImage.JPG
    SnipImage.JPG
    41.6 KB · Views: 125
To clarify, do you want weeks across the top or L4 Description?

if weeks - which is how you have set the code up then the last line needs to be:

PIVOT "wk" & DatePart("ww",[MyDate]) IN ("wk1","wk2","wk3"...."wk52");

You'll need to complete all weeks to give you 52 columns but you may then struggle to show these all on one form or report (max width 22 inches so allowing for the L4 Description column gives you less than 3/8" per column which will be pretty unreadable).

See attachement for where you complete the column headings (right click on the upper part of the query builder and select properties

I suspect it would be better if you swapped the row and column heading around to have L4 Description across the top and wk numbers down the side.
 

Attachments

  • ScreenHunter_03 Jun. 05 23.04.gif
    ScreenHunter_03 Jun. 05 23.04.gif
    18.4 KB · Views: 118
Just dug this out from something a while ago which is a crosstab with weeks across the top
Code:
TRANSFORM Sum(Q_Cashflow_Weekly_View.Movement) AS SumOfMovement 
SELECT "►" AS Expand, 
Q_Cashflow_Weekly_View.Company_No, 
Q_Cashflow_Weekly_View.MoveType, 
Q_Cashflow_Weekly_View.TranDetail, 
Left([order],1) & IIf(Right([order],1)="z",1,0) AS MType 
FROM Q_Cashflow_Weekly_View GROUP BY "►", 
Q_Cashflow_Weekly_View.Company_No, 
Q_Cashflow_Weekly_View.MoveType, 
Q_Cashflow_Weekly_View.TranDetail, 
Left([order],1) & IIf(Right([order],1)="z",1,0), 
Q_Cashflow_Weekly_View.Order 
ORDER BY Q_Cashflow_Weekly_View.Order 
PIVOT Q_Cashflow_Weekly_View.Week In (0,1,2,3,4,5,6,7,8,9,10,11,12,13,14,15,16,17,18,19,20,21,22,23,24,25,26,27,28,29,30,31,32,33,34,35,36,37,38,39,40,41,42,43,44,45,46,47,48,49,50,51,52,53,54);
This was displayed in datasheet form rather than continous form and the control labels were recaptioned 0:, 1:, 2: etc (0 because it was a 53 week year) but it fitted.

Thought it might help
 
CJ,

I'll stick to "wk.." column header as it is the norm.
L4 description actually are event activities, each requires bigger column width. When progress at peak, it will be more than 52 columns.

I'll get around with reporting in separate pages when I get there.
I may use your above example as an option.

At the moment this will do and am happy.
Thank you for providing valuable advice.

Cheers :)
21Aberdeen
 
Hi
Currently I'm using crosstab query with "wK" across the top
Expr1: "wk" & DatePart("ww",[PC_Date])

I need help to do other queries to generate result as;
1) show week ending date
2) Fortnightly instead of weekly
3) Period reporting by select date from and date to

Thank you
21Aberdeen
 
Last edited:

Users who are viewing this thread

Back
Top Bottom