Running Graphs in Access

..
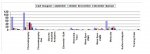
1. How do i get it to show orders that are in this current year, so 2019 but by month view instead, as I notice the query appears to be be picking up orders that were not in 2019. :D
Yes it does, exactly as the example provided by you! :D
I change it now only to show data from the current year. Database attached.
..
2. I noticed you built a table, and then completed a count of what was in the DB and then run the graph from that, how would that work in my current DB as the fields are in the "Sales Data" Tbl.
So far I know I didn't build a table, could you please tell me the name of it and where you see it?
I use the table "Sales Data" and pick the data from that table.
..
3. The names in the Graph also appear to be in a different language format, is this easily changed within my DB? :confused:
It will change automatic depending of local language settings in the Control Panel. If you still get the Danish names for the month, tell me!
..
4. Im assuming that i could add the "Product Line" to my criteria, and then use the opened date as a way of breaking the data down so it only shows orders for 2019 in a month view?
Try it, if you not get the expected result, then show what you get and how you get it, and also how you want it! :)
 

Attachments

Yes it does, exactly as the example provided by you! :D
I change it now only to show data from the current year. Database attached.

So far I know I didn't build a table, could you please tell me the name of it and where you see it?
I use the table "Sales Data" and pick the data from that table.

It will change automatic depending of local language settings in the Control Panel. If you still get the Danish names for the month, tell me!

Try it, if you not get the expected result, then show what you get and how you get it, and also how you want it! :)

Hi JHB,
Thanks for coming back to me. I don't know if its making a difference but I am using office 365 to create my Graphs, which is still using the information from your query but still not reporting correctly, what you have done is reporting correctly but no when i create a graph from it so not sure why it differs though.

Sales data is the information its all taken from.
I have provided a screenshot and also the new zipped DB to show you what i meant.
My existing graphs are in KPI Info, which shows the new one also.

I need the graph to show it how the picture is.
Product line within that month.

It also needs to show the number above the graph so management can pull the numbers.

Stuart
 

Attachments

  • Stuart Graphs (2).zip
    Stuart Graphs (2).zip
    215.6 KB · Views: 119
  • Graphs by Product Line.JPG
    Graphs by Product Line.JPG
    60.5 KB · Views: 113
I'll see what I can come up with, but do you want the month in that order?
attachment.php
 

Attachments

  • August.jpg
    August.jpg
    8.6 KB · Views: 249
I'll see what I can come up with, but do you want the month in that order?
attachment.php


Hi JHB
Thanks...

No I’m not sure why it goes in that order, I tried everything to get it to show sequential..

January, February, etc would be better..

Thanks
Stuart..


Sent from my iPhone using Tapatalk
 
Because A comes before D, and D comes before J etc.


That makes sense now, it was putting alphabetical, you’d think it would have sense to know you are reporting on a month, so put it like it is in a calendar or is that asking it to be too intelligent lol..


Sent from my iPhone using Tapatalk
 
Add a long integer field YearMonth e.g 201801 to your query sql.
Sort the data by that field but do not display it in your chart
 
Last edited:
Add a long integer field YearMonth e.g 20180 to your query sql.
Sort the data by that field but do not display it in your chart
Sorry, but that would not work, because the graph use a transform query!
 
There may be no need to use a crosstab
...
Maybe not, but just in the moment I can't think of anything without involving a Crosstab query, don't hesitate to try! :)
 
Hi StuartG.
That is what you should expect to see when you open the report "Opened by MonthAndProduct line", (except from the name of the month, it will be in you language).
attachment.php
 

Attachments

Hi StuartG.
That is what you should expect to see when you open the report "Opened by MonthAndProduct line", (except from the name of the month, it will be in you language).
attachment.php

Hello JHB,
Thank you for what you have done, its appreciated.
I have used your query to build my graph as my management team preferred the view attached than how the older Access displayed it.
I've provided a picture of the view.

I have noticed though that the graph keeps showing data in previous months/years. I need it to show the current months in the current year.

Further more when I use your query in the access 365 chart builder it appears to not keep the months in sequential order, as previously discussed. :banghead:
 

Attachments

  • SQL View from JHB Query.JPG
    SQL View from JHB Query.JPG
    37.8 KB · Views: 111
  • New Graph Based on JHB Query.JPG
    New Graph Based on JHB Query.JPG
    68.5 KB · Views: 111
Stuart/JHB
I don't have time to assist today but if you haven't already done so, please look at the example database I suggested in post #29.
It sorts the data by month (or other criteria) for selected date periods and doesn't use crosstabs at all for any of the charts
 
Stuart/JHB
I don't have time to assist today but if you haven't already done so, please look at the example database I suggested in post #29.
It sorts the data by month (or other criteria) for selected date periods and doesn't use crosstabs at all for any of the charts

JHB/Isla,
So I think I have now achieved what I wanted. (Hopefully :):) )
This result was after much perseverance and :banghead::banghead:

The report will obviously get more compacted and smaller as the months go on so I am going to watch it closely and then go from there, the idea was to show where our peaks were.
 

Attachments

  • Graphs Acheived..JPG
    Graphs Acheived..JPG
    39.8 KB · Views: 103
..
I have noticed though that the graph keeps showing data in previous months/years. I need it to show the current months in the current year.
..
If you don't want previous months/years in the graph, then you should have avoid them in the example you posted.
 

Users who are viewing this thread

Back
Top Bottom