Table Structure

khurram7x

Registered User.
Local time
Today, 22:38
Joined
Mar 4, 2015
Messages
226
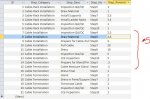
I could not find better way to represent Excel sheets in Access tables.

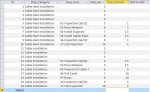
I'm attaching Excel file, sheet ROC in attached file i need to represent in Access table. I've tried to explain a bit in Description column in the end, so that it could make little sense to you guys.
I need to convert other sheets from Excel file to Access as well, but i think I'll be able to start understanding other once i understand how to input ROC sheet in Access table.

Thanks.
 

Attachments

I think I can get you started, however, normalization (https://en.wikipedia.org/wiki/Database_normalization) isn't really something you can do accurately piecemeal. So what I provide might need to be tweaked based on the bigger picture which you haven't made us privy to.

From what I see on the ROC tab, I would lay it out in one table called ProgressSteps, with this format:

Step_ID, autonumber, primary key
Step_Category, text, holds all bolded data in column A (e.g. Cable-Rack Installation)
Step_Desc, text, holds non-bolded data in column A (e.g. Inspection QA/QC)
Step_No, number, holds number step relates to (Row1, Column C - L)
Step_Percent, number, holds percentage of overall it represents


One note, Step_Percent won't be the value you have in the table, it will reflect percentage of whole, not just its category. That means instead of 10% for Inspection QA/QC, it will be 1% (10% of 10%) and instead of 40% for Pull Cable it will be 20% (40% of 50%).

Again, that may be tweaked based on the other data you need to store.
 
Step_ID, autonumber, primary key
Step_Category, text, holds all bolded data in column A (e.g. Cable-Rack Installation)
Step_Desc, text, holds non-bolded data in column A (e.g. Inspection QA/QC)
Step_No, number, holds number step relates to (Row1, Column C - L)
Step_Percent, number, holds percentage of overall it represents
Thank you plog, at least you made me get started. I'm not worrying about Normalization for now, i'll do later once i start getting sense out of it. you see the structure is fairly complicated and sheets ROC, 496G and 496D are inter-related. I just accepted to create a database on Costing and Planning, when I didn't know the thing about it, so this is something i need to make myself privy of )

But in this table structure, i'll not be able to show the part of the percentage that each step will be representing, like Cable-Rack Installation is 10% of the full work but it further needs to be divided into its own 100% and further divided into steps, i.e. Inspection QA/QC non-bolded column of table, etc. how do you think i'll be able to get around this??

One approach I was thinking is to create a separate table for the first step, i.e. the text bolded in first column, and assign the percentage of work to each step, put some kind of a restriction that each selection could be made only once and make sure that total of percentage doesn't increase above 100. This way I'll also be able to show the true percentage of works from first column of non-bolded text in the other table. What will you advise, is it a correct approach or there's a better way please?

Thanks
 
I'm not worrying about Normalization for now,

Actually you are. That's the term for the issue you posted: Properly setting up tables.

I believe my approach is the correct one.

But in this table structure, i'll not be able to show the part of the percentage that each step will be representin

Actually you will. You will do that by adding up the values of its components. One of the major purposes of normalization is storing data in its most grainular form, another is not storing redundant data. Storing it as I described accomplishes both while allowing you to achieve what you want--determining component percentages of their category and category percentages of the whole.
 
Actually you will. You will do that by adding up the values of its components. One of the major purposes of normalization is storing data in its most grainular form, another is not storing redundant data. Storing it as I described accomplishes both while allowing you to achieve what you want--determining component percentages of their category and category percentages of the whole.
Thanks. Yes, I'll be able to show the part of the total percentage after summing, but there's no automatic way to calculate before entering the data per component (non-bolded items in the first column), for e.g. that 'Cable Installation' is 50% of the total job. One has to calculate the values manually accordingly before entering into the table to reflect 10% or 40% or 50% of the total work distribution.
Or, i'm not understanding things properly??

I'm also attaching the screenshot, to make sure i'm getting the correct idea.

Regards,
Khurram
 

Attachments

  • ROC.JPG
    ROC.JPG
    82.2 KB · Views: 120
but there's no automatic way to calculate before entering the data per component

I don't really understand the issue. You will have to do the same no matter what structure you enter the data into. Plus, its a one time deal right? I mean this table is the basis for all calculations right? You won't have a bunch of calculations for a different type of projects (if so, your initial data set didn't make that clear).

Looking at your table, you made 2 mistakes:

1. Step_No should be a number--there's no need to prefix the value with 'Step'--its implied and will only screw things up when you try and order the data. Give it a shot as a matter of fact, sort your table Ascending by Step_No. It won't sort in the order you want. That's why you should use a number data type for that field.

2. I don't believe Step_Percent is a number either. Looks like you have it as a text type. Numerical data should be stored as such, not as text. There's a difference as I identified in that sorting demonstration. Store your data with the right type.

Other than that it looks good. Once you get it into the correct data types we could build a query or two to allay your fears of the caclulations at the Category level.
 
You will have to do the same no matter what structure you enter the data into. Plus, its a one time deal right?
I understand your point. I'll try to make it useful.
Actually ROC sheet is basis of all calculations for all other sheets in early Excel file i attached. For e.g. 496D and 496G (496 is project number). That is where it'll start making a difference in calculations, that's why I was trying to do the other way as compare to way you've suggested. i think i'll start coming up with questions on complications in computations too)
Yes, its a one time deal per project.

You won't have a bunch of calculations for a different type of projects (if so, your initial data set didn't make that clear).
I'm not sure if i'm understanding your clearly or not, but every project has different components, like for this project steps are Cable-Rack Installation, Cable Installation, etc. but for another project it might be completely different with different scope of works. For e.g. Piping project components will be different.
For every project there will be a new Database but the structure will remain same.

Looking at your table, you made 2 mistakes...
Thanks for correction, don't know where my mind was when i was assigning data types.

I'm attaching updated screenshots. Just wanted to make sure is it ok to include steps in the database when there's no work at that stage. For e.g. there's no work at first four steps of Cable-Rack Installation?

First database couple of months ago I created was for HR Training Schedule. This one is for Costing, much bigger in scale and complicated, with much needed help.

Thanks for help on initial design for ROC sheet. What do you suggest for design on 496D sheet? Do have a look at formula's on that sheet too, if you get a chance please.
 

Attachments

  • ROC.JPG
    ROC.JPG
    68.2 KB · Views: 117
Last edited:
For every project there will be a new Database but the structure will remain same

That's not how this should work. One database to hold all your data. You build your database with a Projects table so you can keep track of them.

Just wanted to make sure is it ok to include steps in the database when there's no work at that stage

Possibly. But looking at your screenshot, you have blank Step_Desc fields--you shouldn't have that, especially multiple ones. If there's no step, there's no need for a record. That means you don't need those first 4 records.

Also, every discrete piece data goes in its own field. That means you shouldn't be prefixing your Step_Desc with numbers. If they are significant, they go in their own new field. Honestly, they seem like they should be in the Step_No field. What do those numbers mean?
 
Thanks again. Numbers in Step_Desc are just for sorting purposes in CrossTab, like i posted in another post. Again this is just a testing )...

By the way, did you get a chance to look at 496D sheet from Excel file?
Re-attaching.
 

Attachments

I looked at it. Seems very similar to ROC. I don't have a big picture view of your project, so I can only help generally. You shoudl provide a plain-English (no database/spreadsheet jargon) description of the system/process this data models in the real world.

Also, give it all a shot yourself. Read my links on normalization, then take your data and try and build hte proper table structure for it all. Post back here what you created and we can discuss.
 
Well, the Excel sheet I pasted above is what I received from our Costing and Planning department. Basically, this sheet is based on cable pulling project and shows percentage of overall work, percentage of work component from this overall work, man hour required for the job and then division on this man hour based on the percentage of work required at each component of the work, unit rate applied per meter cable pulled, quantity of total cable to be pulled and unit of measure to quantify the amount of work done. Further, each Step (which is a matter of concern for me at the moment) shows the amount of work done, calculated on basis of total man hour required for each step of a job.

This is the overall description, without any reference to Excel/Access file, and i know it does not clarify thing. So where do i need to explain more, please let me know. After that we might be able to explore files in a better way!!

Thanks.
 
So where do i need to explain more, please let me know.

Technically you used no database jargon, but you used a lot of industry specific jargon I have no context for: "unit rate applied per meter cable pulled". I know what each of those words means individually, but I have no idea what it means to your business. In fact, I have no idea what business you are in. Do you work for the electric company? Home security? Mining company? No idea.

Worse, I have no idea what purpose your data is to serve. I'm looking for something like this:

I manage contractors who install electrical cable in homes. We are trying to budget time and costs down to individual steps per contractor. This data allows us to set goals and then when the contractor is done, measure their performance against those goals.

That's what I am looking for. Something you would tell a 6th grader on career day.
 
I manage contractors who install electrical cable in homes. We are trying to budget time and costs down to individual steps per contractor. This data allows us to set goals and then when the contractor is done, measure their performance against those goals.
Thanks for feedback. Ok, basically I work in Oil and Gas industry for an Electrical, Instrumentation and Commissioning company. Electrical services major, this is why you're looking at lot of Electrical terms in uploaded files.
Our company provide these services to drilling companies, mainly when drilling company is constructing a new drilling site.
On this project, our company is working for 'Chevron' and Cable Pulling is part of the job along with other components of the job like Cable Installation, Cable Termination, Electrical Equipment, etc.
This is a general description, without any database involved.

Little about myself... Basically I'm Network Infrastructure guy and looking to change my area towards Databases and Programming because this was my main interest initially in IT. My company is providing me the opportunity and I'll get more jobs and lot of learning and growth if I do this project successfully. The problem is, that they don't want to give me lot of time before they move to someone else for development and this is what I don't want, because it'll stop my learning. I'm in an area where getting someone to help on this subject is virtually ZERO, and that is why forums are one of my main source in learning and in need. My progress is very slow at the moment in a 12 hour working day, and could not get over the proper table structure until now (
 
Have you given your structure a shot yet? Can you post a screenshot?
 
Have you given your structure a shot yet? Can you post a screenshot?
Uploading the database, you'll be able to look at relationship diagram. This is what i'm able to come up at this stage. I'm trying to use report to apply with my solution, and I made a bit of change in your initial table suggestion to get my calculations.
http://www.access-programmers.co.uk/forums/showthread.php?t=280564

There's nothing confidential at this stage. Don't worry about the form/querie/report naming convention, i just named them for my convenience at this stage.

Once again, I'm not sure how this type of Excel format could be presented in Access in correct and professional manner. I'm ready to accept ideas at this stage because i sense that my approach is not correct, but i need to come up with something by the start of next week.
 

Attachments

The tables look fine. As for getting the report you want in the look you want, your best bet is exporting to Excel and pivoting. Yes, you can probably get close to the data in a cross-tab query in Access, but those are a pain to build Reports off of.

I would use Access to manage your data, then Excel to hit the format of the reports you want to generate.
 
The tables look fine.
Thanks, at least something is in the right direction.

As for getting the report you want in the look you want, your best bet is exporting to Excel and pivoting.
Well, i rarely worked on Excel and at the moment i'm spending all energies to learn Access. Some hint on how to achieve this will be useful, for me to work out in that direction please?

Yes, you can probably get close to the data in a cross-tab query in Access, but those are a pain to build Reports off of
How is it possible to get sub total, of another set of sub totals in Access reports. Is there a way out??

Additionally, I had request earlier about letting me know the best way, to deal with this type of data in Access/Databases that has been presented to me in Excel Sheet, attached earlier. Because, as I understood from some other posts, this approach that I'm taking is not quite right. If i'll know the other ways around, I'll take it and convince the Manager.

Thanks
 
For crosstabs, try this link: https://support.office.com/en-au/ar...ab-query-8465b89c-2ff2-4cc8-ba60-2cd8484667e8. Also, I thought I saw another post you opened about that.

What you should do is populate your tables with sample data, manually create the report you want (with the corresponding values that are in Access) and then try and duplicate that report in Access. Usually building a report in Access starts with writing queries, then moves to creating a Report based on those queries and fine tuning the specific layout.
 
Ok, almost 9 o'clock in the night and am still in office. I know things about queries and reports and will read about cross tab tomorrow morning.
I think we have a big time difference, could u post something about exporting to Excel thing and things you spoke about earlier so that I won't waste time in the morning and learn something about it too please??
 

Users who are viewing this thread

Back
Top Bottom