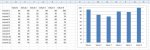
I'm trying to create a simple chart in Access but I can't seem to do it. I can create it very easily in Excel. It's just a simple posting of values that I want to give a report on with every record. I'm including an example of what I would like to do...(but with ACCESS, not Excel)
It's basically a set of scores for students. I remember reading somewhere how someone created a chart using VBA with boxes, and not the charting system in ACCESS but I can't seem to find that again.
Also, I want to be able to report on each student separately. That is, they are doing 6 tests and I want to show how they did on those tests with a simple bar graph. (I'm also open to other ideas though)
If the solution is already listed on this site somewhere, I would love it if someone could point me in the right direction. I've been looking for ages, but I can't seem to find what I'm looking for.
Thanks for any help!
")