Access Charts Ignoring Duplicates

r24igh

Registered User.
Local time
Today, 10:11
Joined
Apr 18, 2016
Messages
16
Hi All,

Apologies in advance if this is a) the wrong place to post and b) it's been solved - I've looked for 2 days and can't see anything - only how to hide duplicates.

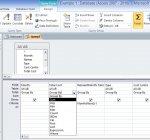
I'm creating a spend reporting database that feeds data from excel into an access DB. The link works and the underlying data is correctly pulling through. However, the issue I have is that when trying to create charts, for whatever reason the charts ignore duplicate values which is not what I want. It messes up the data and means my report is useless...

I've tried looking at the indexes, filters etc and it's none of those. When I export the DB data to excel, the totals are correct so I know the data isn't the issue either!

Any help is much appreciated.
 
Try by creating a query to see if the data is as expected, if yes then set the row source for the graph to the query.
 
Apologies, I should have said in the original thread. All of the charts feed off queries, built from the linked data. Some of the charts are combining up to six queries in Union.

The underlying data in the queries is correct and all totals are there. It just seems that for whatever reason, it's automatically removing duplicates.
 
Okay - to get further then show some sample data and what you expect to get and what you actually get!
If you zip it, then you're able to attached files.
 
Probably obvious though how do I upload data?
 
Response to a thread, scroll a little down, then click the button "Manage Attachments", (in the "Additional Options").
 
Thanks!

Data is attached along with mock DB. The total should be over 10k but the charts are pulling in way less than that.
 

Attachments

Have a look at your union query - you are adding the same table twice.
Code:
SELECT Expense.[Total Cost], Expense.[Cost Centre], *
FROM Expense
UNION SELECT Expense.[Total Cost], Expense.[Cost Centre], *
FROM Expense;
 
Sorry - rushed through that to make an example.

Attached is a DB and the test data. As you'll note, the Graph "Previous Month's Spend" is over £1000 less than the data date the query is feeding from, the ALL AB query. The data is there, for some reason it's being ignored though.
 

Attachments

Last edited:
It is because the query "Previous Month's Spend" is a summing query, but you are not summing anything - you're are only grouping the data, therefore duplicates are ignored.
Change it to a select query or do the summing.
 
Great! Thanks so much I tried and it worked. For clarity, what do you mean by "do the summing"? Also, would you mind giving me an example of what I should be doing to sum columns? I.e., what the SQL would look like. In the actual database there are a lot of columns being summed in different queries.
 
See the below picture.
attachment.php
 

Attachments

  • Sigma1.jpg
    Sigma1.jpg
    80.5 KB · Views: 281

Users who are viewing this thread

Back
Top Bottom