vba_php
Forum Troll
- Local time
- Yesterday, 23:22
- Joined
- Oct 6, 2019
- Messages
- 2,824
hey you guys,
Does anyone here have knowledge of creating graphs in excel? I've always hated doing graphs and charts so I've not done much of it. This person gave me this:
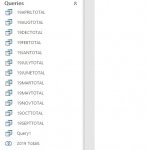
and they created it by doing a ton of redundant things, like creating 1 access query per month, then using a union query to join them all, seen here:
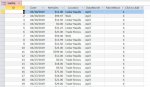
they've asked me to automate everything so the business owner only presses 1 button and sees it all happen. that's not a problem, but this person wants me to retain all the data in an excel sheet so he can create a graph from it. So, my question is, are graphs created from raw source data like this?
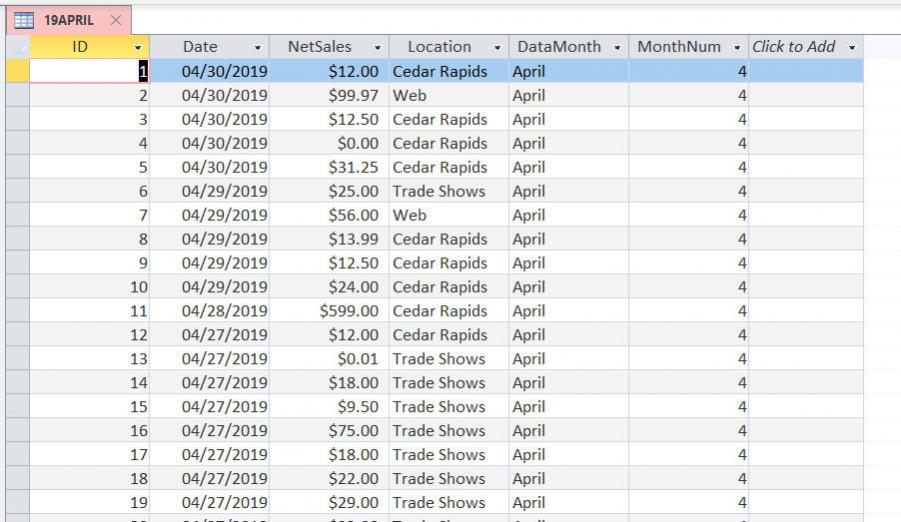
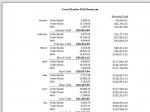
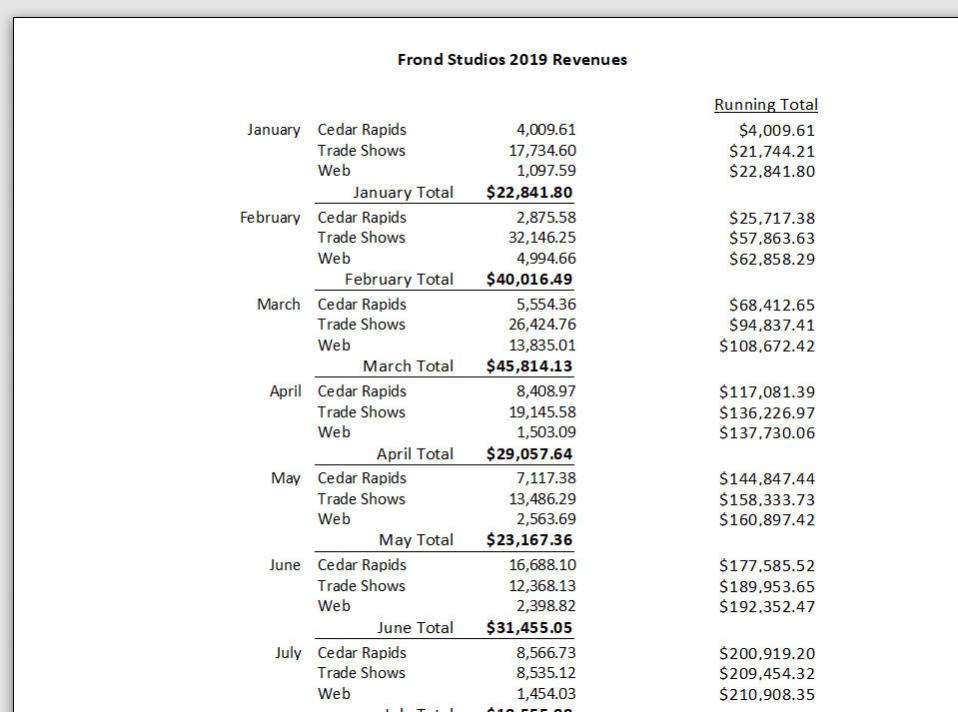
or can they be created from the summary "group by" data that can be seen in the first image above, which is an access report? thanks! (all this data is dumped from the mobile app called SQUARE.
Does anyone here have knowledge of creating graphs in excel? I've always hated doing graphs and charts so I've not done much of it. This person gave me this:
and they created it by doing a ton of redundant things, like creating 1 access query per month, then using a union query to join them all, seen here:
they've asked me to automate everything so the business owner only presses 1 button and sees it all happen. that's not a problem, but this person wants me to retain all the data in an excel sheet so he can create a graph from it. So, my question is, are graphs created from raw source data like this?
or can they be created from the summary "group by" data that can be seen in the first image above, which is an access report? thanks! (all this data is dumped from the mobile app called SQUARE.