Hi all,
I have created some Graphs based on a query but the results are not reporting my requirements.
Issue
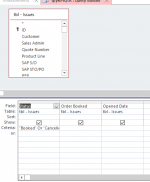
Below is the query
I only wanted it to include all orders apart from orders not yet booked.

Graph output
No records showing
Desired Effect.
I would like the graph to show only records that are created within 2021 QTRs, but needs to reset when the next year happens.
Using the criteria outlined above.
Can anyone point me in the right direction where I could be going wrong?
Thanks
Stuart
I have created some Graphs based on a query but the results are not reporting my requirements.
Issue
Below is the query
I only wanted it to include all orders apart from orders not yet booked.
Graph output
No records showing
Desired Effect.
I would like the graph to show only records that are created within 2021 QTRs, but needs to reset when the next year happens.
Using the criteria outlined above.
Can anyone point me in the right direction where I could be going wrong?
Thanks
Stuart