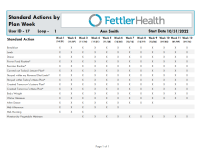
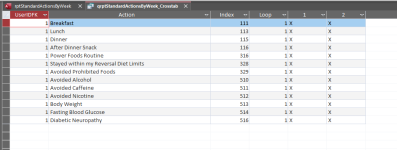
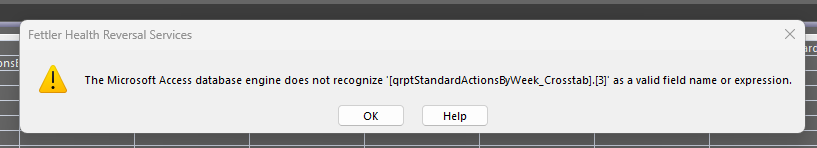
Hello, I have a report that uses a crosstab query for 12 weeks. I would like to monitor the data even after a few weeks, but I get an error when running it without the data for the full 12 weeks.
When I run the query separately, it works fine, but the report is set up for all 12 weeks. Is there a way I can get it to print just blank for the weeks I don't have?
When I run the query separately, it works fine, but the report is set up for all 12 weeks. Is there a way I can get it to print just blank for the weeks I don't have?
")